In this section we focus on one aspect of firm and industry response to changed market conditions-factor substitution induced by changed factor prices. A model of technique choice by the individual firm is set forth, and its implications for the phenomena of factor substitution at the firm and industry level are explored. The conclu sions are “standard,” but the mechanisms involved are very different from those of orthodox theory. To highlight the contrast with orthodox theory, we assume here that the routinized decision rules of firms produce absolutely no factor substitution; only search and selection effects exist. The model rests on a very simple abstract rep resentation of the idea that firms search for cheaper production tech-niques.
The analytical framework here is similar to that of the previous chapter. In each time period, each firm has a given capital stock and operates a single production technique (fixed coefficients). We as sume for simplicity that there is no flexibility to the output decision rule; the technique and capital stock of a firm thus determine its out put and variable inputs in a time period. The industry faces a downward-sloping demand curve for output. From period to period, firms expand or contract according to their profitability, and firms search for better techniques. When a firm finds a new technique through search and adopts it, all of its capital is shifted costlessly to that technique. Output, inputs, and average input proportions in the industry evolve over time as firms change their capital stocks and techniques.
To avoid complications, we will assume t hat all techniques have the same capital-output ra tio, and focus on substitution among vari able factors. Two regimes of constant prices for variable factors, in volving differing relative prices, will be compared . The formal analysis is confined to the case of two inputs, though it may be interpreted as concerned with the consequences of a change of the price of one factor as against the aggregate of all others whose prices remain constant.
At the center of the model is the technique search process for the individual firm. Let q, k, x1 , x2 , be respectively the levels of the firm’s output, capital stock, and two variable inputs. As noted above, we assume that k/q is constant over all possible techniques. Techniques differ in input coefficients a1 = x1/q and a2 = x2/q for the two vari able inputs. Firm search involves a draw on a distribution of alterna tive techniques a1‘, a2‘ near its prevailing technique. When a tech nique is found that is cheaper than the current one at prevailing prices w1 and w2 -that is, when w1a1‘ + w2a2‘ < w1a1 + w2a2 , t he firm changes to the alternative (a1‘, a2‘); otherwise, it sticks with (a1, a2).
Our basic assumption concerning the distribution of alternatives found through search is that proportional changes in input coeffi cients are distributed independently of the prevailing coefficients. It is convenient, therefore, to characterize the process in the space of logarithms of input coefficients . And, since we are particularly con cerned with the evolution of factor ratios, it is also convenient to characterize a technique by the logarithm of its factor ratio,

To locate a technique in the two-dimensional space of logarithms of input coefficients, we need one other coordinate besides U. It is con venient to measure the second coordinate perpendicular to the first-that is, to choose it to be
![]()
Obviously, for a given U coordinate, a technique with a smaller V coordinate is better than one with a large V coordinate. A locus in the (a1, a2) space on which V is constant m ay be thought of as an iso quant of a Cobb-Douglas production function characterized by equal exponents for the two factors -but this is only a formal corre spondence and has nothing to do with out economic argument.
We will consider a denumerable array of possible techniques that i nvolves finitely many values of U, indexed from 1 to N, and infi nitely many values of V, indexed from -∞ to +∞. More specifically, possible techniques differ in their U and V values by integral mul tiples of a constant Δ. This constant is arbitrary (except as noted in the discussion below), and its effect could equally well be repre sented by an appropriate choice of the base to which the logarithms are computed. Let u1 , u2 , … , un and . . . , v-2 , v-1 , v0 , v1 , v2 , … represent the different possible values of U and V. By tech nique (i, j) we mean the technique characterized by the pair

Here, U0 is a constant that anchors the range of factor ratios under consideration, and Δ corresponds essentially to the p roportional dif ference in the size of adjacent input coefficients in the array. It is eas ily seen that the input coefficients of technique (i, j) are

Figures 7. 1 and 7. 2 illustrate such an array of techniques in both the (a1, a2) and (log(a1), log(a2) spaces; Δ has been chosen to be log(2) for illustrative purposes.
The search scheme may now be characterized. Let the technique of a particular firm at time t be technique (i, j); that is,

The search outcome is determined by an integer-valued random pair (Gt , Ht) that essentially represents the number of steps the firm t akes in the U and V dimensions, subj ect to the quali fication that the U values can only range from u1 to uN :


7.1 Technique array in input coefficient space

7.2 The same array in log(a1), log(a2) space.
Random variables (Gt , Ht) are independent of ( Ut, Vt) and all prior values of ( U, V), are jointly distributed in a bounded region -B ≤ (G, H) ≤ B, and should be thought of as in dexed by firm number as well as by time periods. They are independently and identically dis tributed over firms and time. If the technique implied by search out come (U’t+1 , V’t+1) passes the cost reduction test described above, then Ut+1 = U’t+1 and Vt+1 = V’t+1 . Otherwise, Ut+1= Ut and Vt+1=Vt. Note that the distribution of alternatives discovered through search has been assumed to be independent of factor prices, but the distribution of alternative techniques adopted is affected by factor prices through the cost reduction test.
This search-and-test scheme determines a probability distribution for period (t + 1) technique conditional on the period t technique, a distribution that depends on the distribution of (G, H) and on the factor prices. (We assume here that probability “piles up” at the boundary values of u1 and uN; for e xample, all of the probability asso ciated with G values such that G ≥ N – i is assigned to the outcome U’t+1= uN) The independence assumptions made above imply that the sequ ence of techniques employed by a firm over time forms a Markov chain. A significant feature of this chain is that the sequence of factor ratios of the firm, exp( Ut), is itself a Markov chain-in fact, a finite Markov chain with transition p robabilities that are constant over time. This follows from the easily verified fact that exp(Vt) cancels out of the cost comparison inequality. The same (G, H) pairs that produce, for example, a u3 to u7 transition when Vt = V21 also do so when Vt = V-57 or for any other value of Vt
The behavior of a firm’s factor ratio over time may therefore be characterized by an N by N transition probability matrix F = [fik], i, k = 1, . . . , N, where state i is associated with factor ratio exp(ui) and lik is the probability that state i follows s tate k. This transition matrix is constant over time, but depends on the factor prices used in the cost comparison.
Two properties of matrix F are central to the argument that follows. The first is that a rise in the price ratio w1/w2 increases the probability of higher-numbered states (higher a2/a1) conditional on each and every initi al value of a2/a1. Specifically, if fik are the coefficients following the increase in the relative price of variable factor 1, we have

In the form stated, this property holds with full generality given that the matrices F and Fˆ derive from the search-and-test scheme described above. This may be verified simply by comparing, for a given initial pair (a1 , a2), the regions in the input space that satisfy the cost comparison test for two different input price ratios ; the as sumption that makes such a comparison relevant is that the search-generated d istribution of alternatives does not depend on the prices. The second property is that the columns of matrix F are or dered by a relation similar to that above:
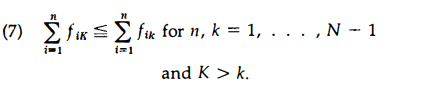
That is, conditional on a higher-numbered state the probability of going to a low-numbered state is smaller t han it is conditional on a lower-numbered state. This mathematical property is a plausible translation of the economic idea that search is “local”-that is, that it involves incremental modifications of existing techniques. Local search is not likely to change the factor ratio very much and ratios near the initial one are the most probable. The probability of winding up at a ratio lower than any particular value is thus higher if the initial ratio is itself low. Here we will simply assume that (7) holds for matrix F. However, at the price of some additional assump tions on the search-and- test scheme, and some tedious argument, this property can be established as a theorem. What is required is a stronger fo rm of the concept that search is “local”: Il is very small and the integer B is large but still small enough to leave Bil much smaller than one; also, it is required that the probability distribution of (G, H) not be too irregular.6 On these same assumptions , the in equalities in (6) and (7) will hold as strict inequalities (except that, in the case of relations (6), the fact that we are dealing with a discrete probability distribution makes it possible that a very small price change might leave the outcome of the cost reduction tests un changed at some or all points of the array) . We assume that the rela tions are in fact strict.
Analysis of the dynamic behavior of the factor ratio in a given firm is n ow a straightforward application of the mathematical results set forth in the appendix to this chapter. At the time of the increase in the relative price of factor one, the firm will be characterized by a particular a2/a1 ratio = exp(ui). Its probability distribution over the N states of the Markov chain is at that point characterized by the unit vector δ1 ; with one in the ith place and zeroes elsewhere. From time τ on, the evolution of the firm’s factor ratio is governed by transition matrix Fˆ rather than by F. In the notation of the appendix we have as sumed Fˆ > F, which means that every column of F shows some displacement of probability toward higher-numbered states relative to the corresponding column of F. The ordering property we have as sumed to hold among the columns of F is called condition ( * ) in the appendix. Theorem 3 of the appendix (and the following discussion) says that under these conditionsFˆt > Ft. This obviously entails for t > τ
![]()
That is, the change in the price ra tio at time T has shifted the proba bility distribution of the factor ratio at every time after T in the direc tion of higher values of a2/a1. The same shift holds in the limit, when the probability distribution of the state has converged to a stationary distribution that is independent of the initial condition (see Theorem 4 of the appendix) .
Consider now what happens to the average factor ratio displayed by the industry. The foregoing analysis applies to each indivi dual firm, with the proviso that different firms will in general have time τ factor ratios exp(Uτ) as well as different values of Vτ . The factor price change displaces the post-τ probability distribution for each and every firm in the direction of higher values of a2/a1 ; remote future from time τ, one sees the distributions for all firms converging to the stationary distribution associated with transition matrix Fˆ. Thus, it is clear that the probability distribution of the un-weighted average of firm factor ratios for every time t > τ is displaced in the standard direction by the price change, and that the expected value of the (unweighted) average ratio for large t is in creased from

where s and sˆ are respectively the stationary prob ability vectors asso ciated with matrices F and Fˆ.
Of course, the actual ind ustry aggregate x2/x1 ratio is the capital weighted average of indivi dual firm ratios. This means that selection effects are involved in the change of the industry ratio, along with the search e ffects already analyzed, and this introduces some compli cations. Formally, let Iim(t) = 1 if at time t firm m has Ut = ui, and Iim(t) = 0 otherwise. That is, Iim(t) is sim ply, for each m , the random N-vector indicating which state of the factor ratio Markov process firm m is in at time t. Let Zm(t) be the capital share of firm m:
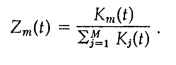
Then the factor ratio of the industry as a whole may be written as

Take the expectation of a(t) :

The analysis above implies that for large t (and for all m), E(Iim(t)) is approximately equal to Si as compared to the value sˆi it would have if the factor price change did not take place. Since the capital shares sum to one, this means that E (a(t)) differs from the unweighted average characterized previously by the sum of the covariance terms Cov(Zm(t), lim(t)). The substantive questions posed by the presence of these covariance terms are whether a change in factor prices can produce a perverse change in the covariance, and, if so, whether that constitutes a significant nonstandard effect on the behavior of the in dustry aggregate factor ratio. Our answers to these questions are not . as sharp as we would like.
Our assumption that search is local means that the positions of firms in the range of possible factor intensities tend to be roughly persistent over time. This being the case, it is clear that a change in factor prices impinging on the particular industry state of t = τ tends to produce, in the following periods, selection effects in the standard direction. (As we noted earlier in this chapter, the relevant compari son here is with what would have happened absent the price change.) For a major price change, there may be a prolonged tran sient phase during which search effects gradually move the bulk of the weight in the factor ratio distribution into an entirely new range. If, in a particular realization o( the process, a particular firm gets ahead of the pack in moving its factor ratio in the right direction during this transient, it will, in that realization, have an episode of better cost reduction experience and relatively more growth than it would have in a realization in which it chanced to lag. Thus, looking into the near future from the time of the price change, the covariance between capital shares and factor ratios may be seen as a partial re flection of the role of the selection mechanism in the response to the’ price change.
Looking into the more remote future, however, all individual firms are seen as distributed across factor ratios according to the sta tionary probabilities s. Although cost reduction experience is related to factor ratios and factor ratio changes from time period to time period, the capital share of a firm reflects its entire history, in which the most recent periods play a negligible role. It therefore seems a plausible conj ecture that the covariance between factor ratios and capital shares tends to zero in the limit as time goes to infinity. A proof of this conjecture could only be set forth in the context of a more explicit formal model of the firm growth process than we have provided here. We have verified the conjecture only for some models that have the somewhat objectionable feature that the ind ustry is a near monopoly almost all of the time- although not always with the same firm in the dominant role . The tendency for industry structure to be degenerate in the long ru n, in this sense or even in some stronger sense, is a characteristic feature of industry models that in volve or approximate the “Gibrat’s law” property of independent random growth rates that are independent of firm size. Such models have considerable substantive importance as well as technical inter est. We will return to these issues in Part V.
Source: Nelson Richard R., Winter Sidney G. (1985), An Evolutionary Theory of Economic Change, Belknap Press: An Imprint of Harvard University Press.