The classic form of an organizational learning curve is
![]()
where
y = the number of labor hours per unit
a = the number of labor hours required to produce the first unit
x = the cumulative number of units produced through time period i
b = the learning rate
i = a time subscript
Researchers have found that other outcomes such as defects per unit (see Fig. 1.2) or accidents per unit (Greenberg, 1971) follow a learning-curve pattern. Thus, y in Eq. (1.1) could represent a range of outcomes associated with the production of the xth unit.
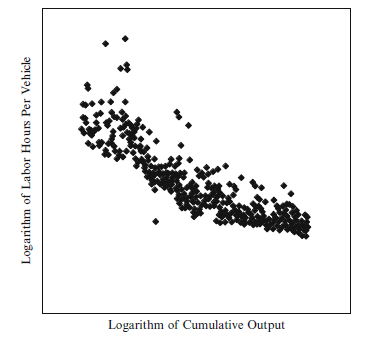
Fig. 1.5 The relationship between logarithm of labor hours per vehicle and logarithm of cumula- tive output. Note: Reprinted by permission from L. Argote, D. Epple and K. Murphy, An empirical investigation of the micro structure of knowledge acquisition and transfer through learning by doing, Operations Research: Special Issue on New Directions in Manufacturing, Volume 44, Number 1 (January–February, 1996). Copyright 1996, The Institute of Operations Research and the Management Sciences (INFORMS), 7240 Parkway Drive, Suite 300, Hanover, MD 21076 USA. Units omitted to protect confidentiality of data
For estimation purposes, Eq. (1.1) can be rewritten in logarithmic form:
![]()
When converted to logarithmic scales, relationships in the form of the power function shown in Eq. (1.1) become a straight line. Figure 1.5 plots the same data shown in Fig. 1.2 using logarithmic (log–log) scales. That is, Fig. 1.5 expresses the logarithm of direct labor hours per vehicle as a function of the logarithm of the cumulative number of vehicles produced. As can be seen from Fig. 1.5, when plot- ted on logarithmic scales, the data more closely resemble a straight line. Analytic techniques for dealing with any curvature remaining in the data after it is converted to logarithmic scales are described later in this chapter.
The standard measure of organizational experience in the learning curve formu- lation is the cumulative number of units produced or services delivered. This mea- sure is computed by summing the total number of units of output produced or services delivered from the start of operation through the end of each time period. If unit costs change as a function of this measure, other variables being equal, we infer that learning has occurred. That is, if the coefficient of the cumulative output vari- able is significant when Eq. (1.2) is estimated with appropriate control variables, organizational learning is said to occur. Thus, the basic principle underlying the learning curve is that production experience creates knowledge that improves productivity (Arrow, 1962).
Debate has occurred among researchers about whether the cumulative number of units produced at an organization is better than calendar time as a measure of experience. The cumulative output measure reflects experience at a particular orga- nization (or unit of an organization). For example, as organizations acquire experi- ence, members might learn who is good at what, how to structure their work better, or how to improve the layout of the production area. By contrast, the calendar time measure captures general technological improvements in the external environment (Solow, 1957). For example, as time passes, properties of materials might improve or computing power might increase. These improvements in the general environ- ment could translate into a reduction in a firm’s unit costs. Further, these improve- ments might be correlated with cumulative output. Thus, it is important to control for the passage of time in analyzing learning rates to determine the extent to which productivity gains are due to technological improvements in the larger environment versus experience at the particular organization.
Studies of organizational learning that have included both calendar time and cumulative output as predictors of unit costs generally find that cumulative output is a better predictor of an organization’s unit costs than time is (e.g., see Darr et al., 1995; Lieberman, 1984; Rapping, 1965). For example, Lieberman (1984) and Rapping (1965) found that time was not significant but cumulative output was when both variables were included as predictors of organizational performance gains associated with experience. In one of our studies, we found that productivity increased significantly with the passage of time—and with increases in cumulative output (Argote, Epple, Rao, & Murphy, 1997). That is, when both variables were included in the productivity models, both were significant. The magnitude of the effect of the cumulative output variable, however, was greater than the effect of calendar time. Thus, it is important to account for the passage of time because it can have a significant effect on productivity. For organizations that produce things with some degree of repetition, cumulative output is generally a more powerful predictor of productivity than simply the passage of time (see also Lieberman, 1987).
Debate has also occurred about whether organizational learning should be defined in terms of changes in cognitions or changes in behavior. This discussion is reminis- cent of an earlier discussion in the psychological literature about individual learn- ing. Certain individual learning researchers defined learning as changes in individual behavior that occurred as a result of experience (e.g., see Hilgard & Bower, 1975). Acknowledging that individuals may acquire knowledge that does not manifest itself directly in changes in behavior, other researchers defined individual learning in terms of changes in “behavior potentiality” that occurred as a result of experience (e.g., see Houston, 1986; Kimble, 1961). Still other researchers of individual learn- ing defined learning as a change in either behavior or knowledge brought about by practice or experience (e.g., see Wingfield, 1979).
At the organizational level of analysis, Duncan and Weiss (1979) and Fiol and Lyles (1985) defined learning in terms of changes in knowledge. Huber (1991) took an approach to defining organizational learning similar to the approach Houston (1986) and Kimble (1961) used at the individual level of analysis. Huber (1991) defined organizational learning in terms of changes in the “range of potential behavior.”
The organizational learning curve approach does not assume that behavior changes as a result of experience but rather examines empirically whether such behavioral change occurs as organizations acquire experience. Thus, by examining the coefficient on the cumulative output variable in Eq. (1.2), one infers whether learning has occurred. If the cumulative output coefficient is significant, learning has occurred—productivity has changed as a result of experience. A positive coefficient on the cumulative output variable suggests that learning is adaptive for the organization because experience improves performance, whereas a negative coefficient suggests that learning is maladaptive because experience impairs perfor- mance. Thus, the learning curve approach allows one to assess empirically whether organizational behavior has changed as a function of experience.
Part of the success of the approach of examining the relationship between cumu- lative output and the unit cost of production to assess whether organizational learn- ing has occurred hinges on one’s ability to control for other factors besides cumulative output that might affect productivity. As noted previously, other factors in addition to experience have been shown to affect the rate of productivity gains in firms. For example, Rapping (1965) showed that economies of scale contributed to the productivity gains observed in the Liberty ship production program. It is impor- tant to control for these additional factors that affect productivity because failure to do so can lead to erroneous estimates of the rate at which organizations learn.
The production function1 approach allows one to control for factors in addition to organizational experience that could affect production. For example, if econo- mies of scale are present, as they were in the Liberty Ship production program, such that a given increase in inputs results in a more than proportionate increase in output and if the scale of operation is increased over time, productivity will rise over time because of increasing exploitation of economies of scale. If one estimates the rate of learning without controlling for the changing scale of operation, this increasing exploitation of scale economies will result in an overestimate of the amount of learning. Womer (1979) argued for the importance of integrating estimation of learning with production function estimation as a vehicle for controlling for the effects of factors other than cumulative output on productivity.
Issues that must be addressed in using a production function approach to estimating learning rates are discussed in Argote and Epple (1990). These issues include selection of functional form, choice of variables in the model, specification of the properties of factors affecting the production process, and choice of an appro- priate method of estimation. An important issue that arises in estimating learning rates is choosing a flexible enough functional form to accommodate a leveling off or slowing down of the rate of learning. Even when learning curves are expressed in logarithmic form, as in Fig. 1.5, there may be a slowing down of the rate of learning over time. The possibility of this leveling off or “plateau” effect is documented in Baloff (1966, 1971) and Conway and Schultz (1959). Including a quadratic function of the experience variable and evaluating it at values less than the value at which the function reaches a minimum can approximate a function with a positive asymptote. Thus, including a squared term for the experience variable allows for the possibility that the rate of learning plateaus or levels off.
It is also important to correct for problems that may arise if data are collected on a per period basis when several periods are required to produce each unit (Womer, 1984). For example, it could take more than one month to build a ship or assemble a plane. If it takes more than one time period to build a product, it is important to deal with this in the analysis by using measures of the fraction of product produced each time period. For example, Rapping (1965) measured the monthly productivity of shipyards by the tonnage of ships produced per month. Tonnage produced per month is the weight of all ships or portions of ships produced during a month. Thus, Rapping’s measurement approach captured all the output, including fractions of ships, produced each time period.
The choice of variables to be included in the model is another issue that must be addressed. The choice of variables varies according to the production process being studied. For example, in studying a single plant with unchanging physical facilities, one would need to include measures of labor hours but not measures of physical facilities, because those do not change. In studying multiple plants, however, it is important to include measures of capital investment and other inputs that differ across plants. Such measures would also be needed if the facilities in a given plant change over time.
When production occurs at several plants, additional variables such as cumulative output aggregated across plants may be included in addition to a plant’s own cumu- lative output to assess whether plants benefit from the experience of other plants. This phenomenon, the transfer of knowledge across organizations, will be discussed more fully in Chap. 6. If the plant has the potential to benefit from improvements in technical knowledge in the larger environment such as developments in materials or computing power, proxies for the pace of such improvements should be included. As noted previously, one such proxy is calendar time (Solow, 1957).
It may also be necessary to control for factors such as product mix and adjustment costs associated with changing the rate of production. For example, some plants may produce a more difficult product mix. Perhaps more complex products or a wider range of models are manufactured at one plant than another. The plant with the more complex product mix may have a higher unit cost than its counterparts that is not due to deficiencies in its learning processes but rather due to the complexity of its product line. Thus, in multi-plant comparisons of learning rates, it is important to control for these differences in product mix since failure to do so will result in mis- leading estimates of the rate of learning. If the product mix changes over time within a plant, it would also be important to control for product mix in single plant studies. Similarly, it is important to control for adjustment costs associated with changing the rate of output (Preston & Keachie, 1964). Lockheed’s production of the L-1011 is an example of a production program that evidenced wide variation in the rate of output. Lockheed experienced considerable difficulties in trying to scale up its rate of output very quickly (The TriStar’s trail of red ink, 1980). These difficulties could result in lowered productivity, independent of the organization’s learning rate.
Failure to control for adjustment costs could lead to inappropriate conclusions about the rate of learning in firms.
Learning curves are often characterized in terms of a progress ratio, p. With the learning curve in Eq. (1.1), each doubling of cumulative output leads to a reduction in unit cost to a percentage, p, of its former value. An 80% progress ratio means therefore that with each doubling of cumulative output, unit costs decline to 80% of their previous value. Thus, an 80% progress ratio means that every time cumulative output doubles, costs decline by 20%. The parameter, b, in Eq. (1.1) is related to the progress ratio, p, by the following expression:
![]()
The progress ratio is the measure typically used by firms to characterize their learning rates.
Source: Argote Linda (2013), Organizational Learning: Creating, Retaining and Transferring Knowledge, Springer; 2nd ed. 2013 edition.