Organizations vary dramatically in the rate at which they learn. Some organizations show remarkable productivity gains with experience, whereas others evidence little or no learning. A study by Dutton and Thomas (1984) nicely illustrated the tremen- dous variation observed in organizational learning rates. Dutton and Thomas plotted a frequency chart or histogram (see Fig. 1.6) of the progress ratios found in more than 100 different production programs in field studies of organizational learning. The field studies were conducted in a variety of industries including electronics, machine tools, papermaking, aircraft, steel, and automotive. As can be seen from Fig. 1.6, there was a tremendous variation in the rate at which these organizations learned. The lowest progress ratio was 55%, indicating that unit costs declined to 55% of their previous value when cumulative output doubled—an amazingly rapid rate of learning! The highest progress ratio was 107%, indicating that unit costs increased rather than decreased with each doubling of cumulative output. The modal progress ratio found in the Dutton and Thomas analysis fell at 81–82%—perhaps giving rise to the often-made assumption of an “80% learning curve.” Although an 80% learning curve is the most frequently observed, Fig. 1.6 underscores the enor- mous variation in learning rates.
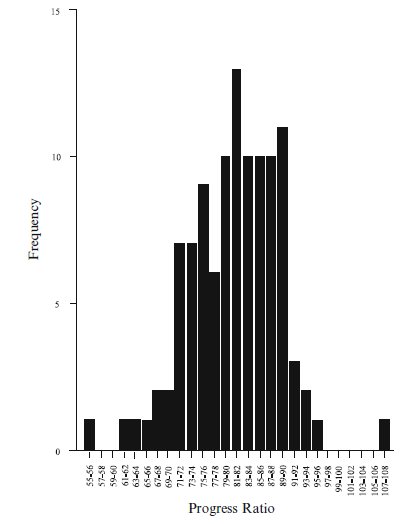
Fig. 1.6 Distribution of progress ratios observed in 22 field studies (n = 108). Note: Reprinted with permission from J. M. Dutton and A. Thomas, Treating progress functions as a managerial oppor- tunity, Academy of Management Review, Volume 9, Number 2 (April, 1984). Copyright 1984
Although differences in product contribute to the variation observed in learning rates, the different rates of learning are not simply a function of the different prod- ucts studied. Dutton and Thomas (1984) found that learning rates differed not only across different industries, processes, and products but also within the same or similar processes and products. There is often more variation across organizations producing the same product than within organizations producing different products. For example, there was more variation in productivity gains across World War II shipyards that produced the same ship than there was within the shipyards that pro- duced different ships (Searle & Gody, 1945). In a similar vein, Hayes and Clark (1986) found considerable variation in the rate of learning across plants in the same firm producing the same product.
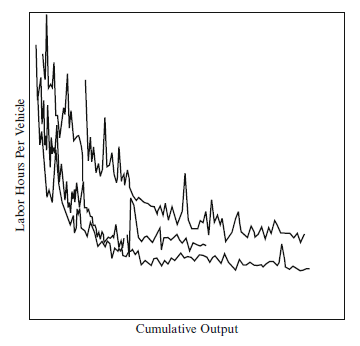
Fig. 1.7 The relationship between labor hours per vehicle and cumulative output for three plants. Note: Reprinted with permission from L. Argote and D. Epple, Learning curves in manufacturing, Science, Volume 247, Number 4945, (February, 1990). Copyright 1990, American Association for the Advancement of Science. Units omitted to protect confidentiality of data
Similarly, Chew, Bresnahan, and Clark (1990) documented large differences in productivity across plants in the same firm that produced the same or similar products with similar technology. The researchers described dramatic differences in performance between the best and the worst plants in a firm. After controlling for differences in plant size, age, location, and technology, performance differences on the order of 2:1 between the best and the worst performer remained (Chew et al., 1990).
Different plants producing the same product that have different rates of learning are shown in Fig. 1.7. The figure is based on data from three truck plants that assem- ble the same product within the same firm. The number of direct labor hours required to assemble each truck is plotted as a function of the cumulative number of trucks assembled. Figure 1.7 illustrates that although unit costs decreased at a decreasing rate with experience for each plant, the rate of the decrease differed dramatically across the three plants. There was considerable variation in the rate at which pro- ductivity grew with experience across the three plants—considerable variation in the rate at which they learned.
Source: Argote Linda (2013), Organizational Learning: Creating, Retaining and Transferring Knowledge, Springer; 2nd ed. 2013 edition.