Finally, a hard systems methodology developed by the author will be presented (Skyttner 1988). It has two explicit starting points, one in GLS theory and one in DYNAMO, a computer language developed by Jay Forrester (see p. 43). The idea is that problems can always be related to one or more of the main flows of matter, energy, or information in a living system. When the problem area is identified it is often found as a consequence of a malfunctioning subsystem. Then measures are constructed and normal values are established for the problematic function. The relationships between this function and other functions or subsystems are then simulated by use of a DYNAMO program and the model is moved through space and time, fed by a continuous series of inputs.
In order to use this idea, a complete working methodology has been developed. It includes a bottom-up approach which generally provides good knowledge of functional principles as well as more detailed answers. The methodology includes the following steps:
Selecting the perspective
- Problem definitions
- Construction of relevant measures
- Problem selection
- System-boundary definition
- System-level definition
- Construction of system block diagram
Identifying system processes
- Identification of essential subsystems
- Identification of matter/energy, information flows
- Construction of causal-loops for model subsystem
- Construction of interaction matrix
- Construction of schematic description
Converting to DYNAMO model
- Identification of useful model subsystems
- Construction of causal-loops for useful model subsystems
- Construction of schematic charts for model subsystems
- Construction of DYNAMO flow charts
- Definition of quantities and processes
- Converting Steps (D) and (E) to DYNAMO computer language
Running the DYNAMO model
- Simulating by changing the parameters
- Verifying the model
- Validating the model
- Documentation of the work
The methodology has, for instance, been used to rationalize the operation of the Swedish search and rescue (SAR) system at sea. The main problem was that there was no specific knowledge of what could be considered to be critical functions or parameters influencing the overall system efficiency. Examples to illustrate some of the working steps are taken from this mission.
The overall measures constructed were human survivability, economical salvage and ecological recovery. The selected problem was to examine the timer function which was estimated to be critical for the system.
The system-boundary was taken to be the geographical area at sea that was the responsibility of the Swedish SAR system. This also included certain land-based locations, such as rescue centres, radio stations, etc. The defined boundary might also be temporarily augmented or changed through cooperative agreements with other national systems.
For practical purposes, the system was defined as belonging to the organizational level. This does not exclude the possibility that it sometimes works on the supranational level.
An extract from the identification of the twenty essential subsystems is shown in the table below (in principle, this is the same kind of identification that was done for a supermarket on page 129).
Matter/energy and information
1. Boundary
- Responsibility area limit
- Air/water vehicle range limit
- Radio/radar/look-out range limit
2. Reproducer
- Renewed international agreements
- The need for better systems
- Commercial interests
- Recruiting officers
Matter/energy
3. Ingestor
- Oil
- Electricity
- Water
- Ventilation
- Food
- Ships, ambulances, aircraft
- Supplies, spare parts
- People
4. Distributor
- Aircraft pilots, ship’s crew, ambulance drivers, servicemen
- The sea, the air
- Pipelines, ventilation shafts
5. Cables
- Converter Oil converters for climate/motion
- Electricity converter for light, radio, radar, telex
- Water coolers
- Human living conditions
- Food preparation and consumption
The extract which follows below is from the identification of matter/energy and information flows between the different subsystems. The alphanumeric designations represent the various subsystems with their subdivisions. It is taken from the list above where for example a flow exists between the oil inlet 3A and the oil tank 7A (not shown in the above list: the complete list of all subsystems in a living organism with appropriate numbers is given on page 123).

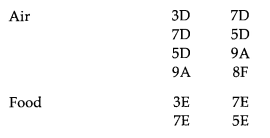
Note that three main system flows can always be identified in living systems, those of matter, energy and information. All flows are entering the system and are to some extent stored. Inside the system, information processes regulate them. This is accomplished by continuously sensing the system’s status. After feeding the processes within the system and simultaneously transforming their own content, the flows leave the system.
The list identifying matter/energy and information flows is transformed into a causal-loop diagram according to Figure 11.3.
The subsequent step was to construct an interaction matrix where all essential subsystems with their subsections were contained in the rows and columns. Listings of the system flows, together with the causal-loops, were used to indicate negative and positive interaction.
The schematic description was then made with the main purpose of enhancing the total understanding of the system. Jointly with the causal- loops and the interaction matrix, this step completes the symbolic presentation of the system.
The conversion to a DYNAMO model was done by transforming the matrix into Forrester schematics with the help of a special algorithm (/. Bums 1977). The strategy of this algorithm is to embed Forrester’s simulation methodology in a mathematical framework which specifies concrete guidelines and rules when a computer program is written. The use of the algorithm ends up with the identification of minor subsystems and a classification of quantities for the Forrester schematics. These data constitute building parameters for the DYNAMO flow chart. Based on this, quantities and processes were defined and the DYNAMO computer program was written. Thanks to the many detailed preceding steps and the ingenious algorithm by Burns, the computer program was very easy to write.
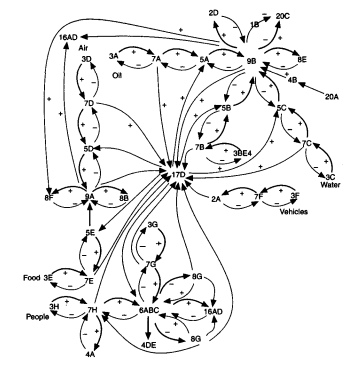
Figure 11.3 Causal-loop diagram for matter/energy flows.
As a result of the simulation, the general knowledge of functional principles for the SAR organization was refined. In the system investigated a three-part M/E process represented the ultimate system goal — to save human lives. This was done by
- removing persons from the danger area, and
- to make this possible, sometimes doing construction and repair work, and
- if necessary giving medical
All this was centred around the motor, producer, and storage functions and was highly time-dependent. The timer function affects such subsystems as channel and network as a result of current radio communication conditions (e.g. effects of sun spot cycles, sun flares, metereological phenomena such as thunderstorms, etc.). Also Motor, Distributor, and Storage are directly timer dependent as a result of seasonal and diurnal variation, which in turn affects the rescue and survival time.
Source: Skyttner Lars (2006), General Systems Theory: Problems, Perspectives, Practice, Wspc, 2nd Edition.