Our primary goal in the franchise study (Darr, Argote, & Epple, 1995) was to assess the extent to which knowledge transferred across organizations. That is, we wanted to examine whether one organization learned or benefited from experience at another. A secondary goal for the franchise study was to determine the extent to which knowledge transferred over time—the extent to which knowledge persisted. Thus, we also investigated whether knowledge depreciated (see Chap. 3).
To accomplish our first goal, we required a study context in which a large number of organizations produced the same product. This would permit us to assess the extent of knowledge transfer across a reasonable sample of organizations. Eric Darr, Dennis Epple, and I identified fast-food franchises as an ideal setting for that pur- pose because many organizations produce a standardized product with similar processes.
Another benefit of studying knowledge transfer in fast-food franchises is that it provides information about the dynamics of organizational learning and transfer in a service industry. Extending research on organizational learning to service organi- zations provides information about the extent to which their rates of learning, for- getting, and transfer compare to those found in manufacturing. Because the USA and other developed economies are increasingly service economies (“Survey of manufacturing,” 1998), understanding the dynamics of productivity growth in ser- vice settings is an important undertaking.
All of the fast-food stores in our study produced the same product (pizzas) and were franchised from the same parent corporation. All of the stores had opportuni- ties to learn from the parent corporation. For example, at the time each store started, the parent corporation provided routines, blueprints, and procedures as well as train- ing. The parent corporation also provided ongoing assistance to the stores. Franchise owners were required to attend yearly meetings of the corporation, and consultants from the parent corporation visited the various stores.
Our primary focus was on knowledge transfer across the stores themselves. Several of the franchisees owned only one store, whereas others owned multiple stores. We analyzed whether stores learned from their own direct experience, whether they learned from the experience of other stores owned by the same fran- chisee, and whether they learned from the experience of stores owned by different franchisees. We also analyzed whether knowledge transferred over time by assess- ing the extent of knowledge depreciation.
1. Method and Sources of Data
We collected data from the entire set of stores in Southwestern Pennsylvania that are franchised from one of the largest pizza corporations. The sample included ten dif- ferent franchisees who owned a total of 36 stores. The largest franchisee owned 11 stores, whereas five of the franchisees owned only one store each. The oldest fran- chise organization had been in business for 11 years, and the youngest for just 3 months. The average age of the franchise organizations was 3.75 years.
The corporation’s regional office provided data concerning pizzas sold and pro- duction costs for each store per week for a one-and-a-half year period. Thus, we had approximately 75 observations for 36 stores, which resulted in a data set of over 2,500 observations. Structured interviews with the franchisees provided additional information about the frequency that various mechanisms were used to transfer knowledge and also about the timeliness of service at the stores.
Table 6.1 Variables used in the franchise study

The franchise data have many attractive properties. The inputs to the production function (i.e., the raw materials) are homogeneous. Therefore, input characteristics are controlled for naturally in the sample. Differences in technology across pizza stores are very small. Thus, factors that may be hard to control for statistically in production environments are controlled for naturally in the sample. The symbols used and the variables they represent are listed in Table 6.1.
In this particular study, the cumulative number of pizzas produced, Q, at a store measures store-specific experience. To investigate knowledge transfer across the stores, we aggregated the cumulative number of units produced by all the stores in the relevant set. Thus, franchise-specific experience, FQ, was measured by sum- ming the cumulative number of units produced by all stores owned by the same franchisee. Just as the cumulative number of units produced at a store measures store-specific experience, the cumulative number of units produced by all stores in the franchise measures franchise-specific experience. Similarly, inter-franchise experience, IQ, was measured by summing the cumulative number of units pro- duced by all stores in all franchises.
We estimated several models in which the unit cost of production was analyzed as a function of store-specific experience, franchise experience, inter-franchise experience, and other variables. The most basic model we estimated using least- squares regression (Column 1 in Table 6.2) was as follows:
![]()
We allowed for serial correlation of the error term, unit, in all the models we esti-mated. We also included dummy variables for each store in all equations. The dummy variables, sni, control for variance associated with store specifics such as management style, age, and location.

In Eq. (6.1), if the coefficient on Q (b1) is significant, store-specific learning occurred. That is, a store’s unit cost was affected by production experience at the store. If the coefficient on FQ (b2) is significant, transfer of learning between stores owned by a common franchisee occurred. That is, the unit cost of production at a store was affected by production experience at other stores in the franchise. If the coefficient on IQ (b3) is significant, transfer of learning between stores owned by different franchisees occurred.
In these analyses, the unit of time is a week. The variables Q, FQ, and IQ are the cumulative pizza production through the end of the previous week. The lagged cumulative output was used on the right-hand side of Eq. (6.1) because cumulative output measures experience acquired as a result of past output.
We used the same approach to investigate whether knowledge persists through time or whether it depreciates as we used in our previous studies (see Chap. 3). We replaced the conventional cumulative output measure with the following variable:
![]()
Equation (6.2) allows for the possibility that knowledge depreciates over time by including the parameter λ. As in our discussion of the shipyard results, if λ = 1, the accumulated stock of knowledge is simply equal to lagged cumulative output, the conventional measure, and there is no evidence of depreciation. If λ< 1, there is evidence of depreciation: recent output is a more important predictor of current productivity than past output.
We also investigated alternative explanations of our findings by estimating models with additional control variables. We controlled for economies of scale in the analysis. As noted previously, the scale of operation might expand as organizations gain experi- ence and, therefore, could be correlated with cumulative output. Some of the productiv- ity gains apparently associated with cumulative output could actually be due to changes in the scale of operation. To avoid this problem, we controlled for economies of scale by including measures of the number of pizzas produced each week and its square.
We also controlled for product mix, measured here by the percentage of “pan” piz- zas. As noted previously, some product options can be more costly to produce than others. Hence, it is appropriate to control for the percentage of these options in estimat- ing learning rates. Furthermore, we controlled for technological progress associated with the passage of time by including a calendar time variable, which enabled us to separate the extent to which productivity gains were a function of general technological changes in the environment versus changes in experience in the particular organization. Finally, we allowed the rate of learning to change over time by including a quadratic term for the experience variable, which enabled us to test whether the leveling off in the rate of learning, or the “plateau” effect observed in several studies, occurred here.
The model that included the full set of control variables (Column 4 in Table 6.2) was as follows:

FK and IK are defined the same as FQ and IQ except that K replaces Q in the summations. Thus, knowledge that transfers was also allowed to depreciate.
An issue that arose in the franchise study that may confront other researchers who study learning in multiple organizations is the absence of data from the start of operation at all of the organizations. In particular, we did not have data from the start of production for half the stores. These stores were in operation several years before the data collection began. We dealt with this limitation by treating pizza production prior to the beginning of the data collection as an unknown coefficient in the model (see Column 5 of Table 6.2) and estimating it along with the other coefficients. As will be seen shortly, the results from estimating that model were virtually the same as from the other models.
2. Results
Results are presented first for store-specific experience and franchisee experience as predictors of the unit cost of production. Results on the extent to which knowledge concerning unit cost of production depreciates are also presented. The results sec- tion concludes with a summary of results obtained when service timeliness rather than unit costs is the dependent variable.
2.1. Store-Specific and Franchisee-Specific Learning
Results concerning the effects of store-specific learning, transfer between com- monly owned stores, and transfer between differently owned stores on the unit cost of pizza production are presented in Table 6.2. This table presents the results of estimating five different models of unit cost. The dependent variable in each model is the cost per unit of producing each pizza. The independent variables in each model vary across the five columns. As can be seen from the table, we estimated increasingly complex models that included more predictor variables.
Results of estimating Eq. (6.1) using a maximum-likelihood estimation algo- rithm allowing for first-order autocorrelation of the residuals are shown in column 1 of Table 6.2. Analysis of the residuals from Eq. (6.1) revealed first-order autocor- relation. There was no evidence of higher order autocorrelation. All of the models shown in Table 6.2 corrected for first-order autocorrelation by jointly estimating the correlation coefficient with other coefficients in the models.
The coefficients of the store-specific dummy variables are not of particular inter- est so are not reported. A joint test of the null hypothesis that there were no store- specific effects was rejected at a high significance level (p < .001), so important store-specific effects are present in the sample. Store-specific dummy variables were included in all analyses. The estimate of the constant term was not of particu- lar interest for the research questions so the estimates of the constant terms were omitted in order to preserve confidentiality of the data.
Column 1 shows the effect of the conventional measure of store-specific experi- ence (lagged cumulative output for each store) on cost per unit. As can be seen from the table, the variable representing store-specific experience has a significant nega- tive coefficient, supporting our expectation that the unit cost of production would decrease as the cumulative number of pizzas produced at each store increased.
Learning curves are often characterized in terms of a progress ratio, p. As noted previously, the progress ratio, p, is related to the coefficient for store-specific learn- ing, b1, as follows:
![]()
Based on the results shown in column 1 of Table 6.2, a progress ratio for the entire sample was calculated to be p = .93. For each doubling of cumulative output, the unit cost of producing a pizza decreased to 93 % of its previous value. Thus, pizza stores in the sample demonstrated a slower learning rate than the modal “80 % learning curve” found in manufacturing firms. Although slower in this service sec- tor than typically observed in manufacturing, the rate of learning was significant.
The effects of transfer between commonly owned stores and transfer between differently owned stores on cost per unit were also presented in column 1 of Table 6.2. The negative coefficients b2 and b3 suggest that both transfer between commonly owned stores and transfer between differently owned stores accounted for significant decreases in the unit cost of production. The latter effect, however, was not robust to alternative specifications of the model.
Models with more control variables were estimated to explore alternative expla- nations for the results. We divided the control variables into two separate sets (col- umns 2 and 3) in order to better understand their incremental impact. In column 2 of Table 6.2, calendar time was introduced to capture the possibility that technical change associated with the passage of time rather than learning associated with organizational experience was responsible for decreases in unit production costs. The positive coefficient for the time variable in column 2 of Table 6.2 indicates that time is not a viable alternative explanation for the decrease observed in unit produc- tion cost. The coefficient on the time variable indicates that the cost of pizza produc- tion increased with the passage of time, perhaps reflecting increases in food and labor costs over the one-and-a-half year period of the study.
Current pizza count and the square of current pizza count were also included in column 2 to capture the possible effects of economies of scale on cost per unit. The negative coefficient for current pizza count and the positive coefficient for the square of current pizza count in column 2 of Table 6.2 indicate that significant scale effects were present. Cost per unit first decreased and then increased with increases in the current volume of production.
The decrease in cost per unit as volume rises from relatively low output levels is natural because some labor and operating costs must be borne in order to keep a store open, and those costs are spread over more units as volume increases. Increasing cost per unit at higher volumes seemed to result from increased coordination costs. Coordination became difficult for high-volume production, especially because less experienced part-time employees supplemented regular employees during peak loads.
Comparing column 1 and column 2 of Table 6.2 reveals that the impact of transfer between differently owned stores was no longer significant, whereas the effects of store-specific experience and transfer between commonly owned stores on the unit cost of production were unchanged with the addition of calendar time, current pizza count, and the square of current count. This illustrates the importance of controlling for scale economies because other variables can pick up their effects if scale vari- ables are excluded.
We conducted a specification test (Hausman, 1978) to assess whether there might be simultaneity in the determination of cost per pizza and current pizza count. Our model allowed for current pizza count to affect costs through economies of scale. The effect, however, might occur in the reverse direction: stores with lower cost per pizza might charge lower prices and thereby generate a higher sales volume. Such simultaneity or endogeneity would lead to biased coefficient estimates. To test for the possibility of endogeneity of current count, the model was estimated with a two- stage least squares procedure that Fair (1970) developed. This instrumental vari- ables procedure provides consistent estimates of models with endogenous variables and serially correlated errors. The coefficient estimates using instrumental variables were compared to the original coefficient estimates. The two sets of coefficient estimates were very similar. A test statistic of 8.16 was calculated for Hausman’s specification test. The test statistic was distributed as X2, df = 44, with a critical value of 60.48 at the .05 level. Thus, there was no evidence of endogeneity of current pizza count in the model.
In column 3 of Table 6.2, the square of the knowledge variable was introduced into the model to allow for possible changes in the learning rate. The coefficient for this variable was insignificant, indicating that there was no change in the rate of learning over the length of the study. Thus, we did not observe a “plateau” effect in this study. The proportion of total pizza production accounted for by pan pizza was also intro- duced into the model at this stage to control for product mix. The estimate of pan pizza effects in column 3 was insignificant, indicating that product mix did not affect the unit cost of production. Comparing column 2 and column 3 reveals that the learning, time, and scale effects were unchanged by the inclusion of these additional variables. The possibility that the results were caused by a few newly opened stores was investigated by removing the four new stores from the sample. The results from the reduced sample were almost identical to the results shown in Table 6.2.
Our results on learning and knowledge transfer in the pizza franchises are illus- trated in Fig. 6.1. The figure depicts the learning curve for a franchisee with a single store and the learning curve for a franchisee with five stores. The learning curves in Fig. 6.1 were plotted from predicted values from the models we estimated based on the franchise data. As can be seen from Fig. 6.1, for every value of cumulative pro- duction on the horizontal axis, the cost per unit of pizza production was lower for the franchisee owning five stores than for the franchisee owning one store. The multi-store network had a larger experience base from which to learn than the single store and thus, had lower unit costs. That is, the stores in the multi-store network learned from their own experience and from the experience of other stores owned by the franchisee while the single store learned only from its own experience.
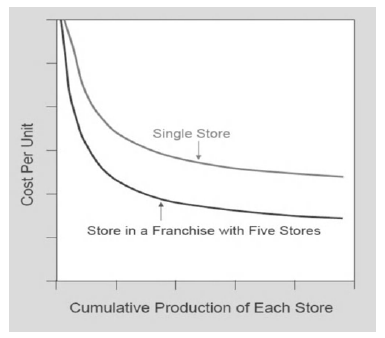
Fig. 6.1 A comparison of learning curves for a single store and a multi-store network
The multi-store network benefited from knowledge transfer across the stores while the single store did not.
2.2. Depreciation
Results on the depreciation of learning are presented in columns 4 and 5 of Table 6.2. Column 4 is a linear model that does not include entire production histories, whereas column 5 is a nonlinear model including entire production histories. The maximum likelihood estimate of λ for the model shown in column 4 was 0.80. The hypothesis of no depreciation (λ= 1.0) was rejected. The depreciation rate is very rapid in these organizations.
Learning curve analysis has traditionally proceeded from the beginning of pro- duction in an organization. The majority of stores in this sample were in operation several years prior to the beginning of data collection. Through further data collec- tion, we obtained complete production histories for 18 of the 36 stores in our sample. The impact of including entire production histories for each store on estimated learn- ing effects was investigated using a nonlinear model in which pizza production prior to the beginning of our sample was added to the store, intra-franchise, and inter- franchise measures of experience. For each of the 18 stores for which we were unable to obtain complete data, production history was treated as an unknown coefficient.
The results of these analyses are shown in column 5 of Table 6.2. Including complete production histories did not change our results concerning store-specific learning, time, scale effects, and product mix. The effect of transfer between commonly owned stores remained significant but became somewhat less significant than that in the previous analysis. The maximum likelihood estimate of the depre- ciation parameter, 0.83, remained significantly less than one in this model.
These results indicate a very rapid rate of depreciation. A value of λ= 0.83 implies that roughly one half (0.834) of the stock of knowledge at the beginning of a month would remain at the end of the month. From a stock of knowledge available at the beginning of a year, a negligible amount (0.8352) would remain 1 year later. In fact, without continuing production to replenish the stock of knowledge, virtually all production knowledge would be lost by mid-year.
We hypothesized that knowledge transfer between commonly owned stores would be greater than transfer between differently owned stores because of greater use of trans- fer mechanisms between commonly owned stores. There are many mechanisms for transferring knowledge across franchises. For example, all franchises are required to attend a yearly meeting. And a consultant from the parent corporation routinely visits each store to provide advice. These transfer mechanisms were more or less constant for all the stores in the sample. Other mechanisms, however, varied across stores. For exam- ple, there was more communication and interaction between some stores than others. We measured the frequencies of phone calls, personal acquaintances, and meetings between the various stores. We found that the frequencies of these communication mechanisms for transferring knowledge were significantly greater between commonly owned stores than between differently owned stores. Further research is needed to deter- mine if these (and other mechanisms) contributed to the knowledge transfer observed.
2.3. Timeliness
We also investigated whether a different but also important outcome, service timeli- ness, evidenced learning (Argote & Darr, 2000). Service timeliness was measured as the percentage of “late” pizzas. We adopted the corporation’s metric for coding a pizza as late: if a prespecified amount of time elapsed from when an order arrived to when the pizza was completely prepared, it was listed as late.
The dependent measure in our analysis of service timeliness was the number of late pizzas per unit of pizzas produced each week. The predictor variables paralleled those previously described for our analysis of cost per unit. Thus, we examined whether service timeliness improved as a function of a store’s direct experience, of the experience of other stores owned by the same franchisee, and of the experience of stores owned by different franchisees. As in the analysis just described of cost per unit, dummy variables for each store and key control variables were also included in the models. In the service timeliness model, we also controlled for labor costs at each store. Finally, we allowed for the possibility that service knowledge depreci- ated by replacing the conventional cumulative output measure with the specification of knowledge shown in Eq. (6.2).
Results indicated that stores benefited from their own direct experience and from the experience of other stores owned by the same franchisee. Service timeliness was not affected by the experience of stores owned by different franchisees. These results paralleled those reported earlier for cost per unit. Knowledge transferred across stores owned by the same franchisee but not across stores owned by different franchisees. Results also indicated that service knowledge depreciated. Recent output was found to be a more important predictor of service timeliness than cumulative output.
3. Discussion
The fast-food stores in our study evidenced firm-specific learning: as they gained experience, the unit cost of production decreased at a decreasing rate. The results on firm-specific learning are robust: firm-specific learning effects contributed to reduc- tions in production cost independent of calendar time, scale effects, and product mix. Additionally, store-specific learning was evident when we added complete production histories and allowed for knowledge depreciation.
This is one of the first studies to focus on learning in service organizations. Although the modal progress ratio in the fast-food franchises we studied was less than the modal figure found in manufacturing, learning effects were significant con- tributors to the productivity of the stores. Further research is needed to determine whether the slower rate of learning is characteristic of most service organizations and, if so, why the rate is slower than that typically observed in manufacturing. To accomplish this, we believe that it will be more fruitful to move beyond the diffuse characterization of “service” versus “manufacturing” organizations and focus on the specific variables that differentiate the two environments.
Indeed the line between manufacturing and service is blurring. Service organiza- tions have looked to manufacturing organizations to learn how to improve their oper- ations. For example, hospitals have copied aspects of the Toyota Production System and realized significant benefits such as reduced errors and improved patient care, as reflected in indicators including reduced infections (Graban, 2012). On the other hand, an automotive company looked to a fast-food firm for ideas about improving performance. Alex Trotman, Ford’s Chairman, sent a task force to McDonald’s to learn how McDonald’s produces the same products around the world (“Survey of manufacturing,” 1998). These examples suggest that many of the underlying pro- cesses in service and manufacturing organizations have much in common. Each type of organization can realize dramatic benefits from learning from the other.
There are also points on which manufacturing and service firms generally differ. For example, there was much less opportunity to match tasks to the expertise and interests of individual workers in the pizza stores we studied than in the manufactur- ing plants. Thus, an important source of productivity gains was not available to the fast-food stores. Similarly, many manufacturing organizations are able to sequence their products in a way that maximizes productivity. This option may not be avail- able to service organizations that produce on demand. For example, the truck plants we studied sequenced their products such that trucks with options that required significantly more steps such as air conditioning were never sequenced back-to- back in the production line. By contrast, the pizza stores produced on demand to satisfy customers and had less opportunity to sequence their pizzas so as to maxi- mize the stores’ productivity. Future research is needed to determine if these factors are the underlying variables that explain differences between rates of learning in service and manufacturing sectors.
The results on transfer of learning extend our current understanding of the condi- tions under which transfer occurs. The results suggest that knowledge transfer between affiliated organizations is greater than transfer between independent orga- nizations. Future research is needed to determine why knowledge transfer is greater between stores owned by the same franchisee than between stores owned by differ- ent franchisees. For example, is the pattern of differential transfer largely a function of differences in motivation, differences in opportunities to communicate, or differ- ences in ability? Competition was minimized in the franchise organizations by cor- porate policies that, for example, limited how close the stores could locate to each other. Also the stores cooperated on marketing and promotions. Although there was little competition between the stores and some cooperation, there were more incen- tives to share information with stores owned by the same franchisee than with stores owned by different franchisees. Thus, differences in motivation could have contrib- uted to differences in the degree of knowledge transfer.
There were also more personal relationships and opportunities to communicate among stores owned by the same franchisee than among stores owned by different franchisees. These results are consistent with past work demonstrating that social networks are denser within related than between independent organizations (e.g., see Tichy, Tushman, & Frombrun, 1979; Tushman, 1977). In the current study, opportunities to share information were greater within than between franchises. Differences in opportunities to communicate and share information could also have contributed to differences observed in the degree of knowledge transfer. Further research is needed to determine why knowledge transfer is greater between affiliated than independent organizations.
The finding that being embedded in a superordinate relationship such as a fran- chise increased the degree of knowledge transfer has important practical implica- tions. It suggests that embedding organizations in a network that gives them a larger experience base on which to draw is a powerful way for improving the performance of a focal firm. This suggestion is consistent with the trend noted on the part of many franchise organizations to move away from single-store owners to owners who own a large number of stores. A Wall Street Journal article argued that most franchise systems are moving away from “mom-and-pop” franchises to franchises where the same individual owns many stores:
Franchising specialists say such high-flying franchisees are becoming more numerous— and vastly more important. Most franchise systems have a growing number of “big boys” with 20 or more stores. For example, Grand Metropolitan PLC’s Burger King Corporation unit in Miami says five U.S. franchisees top the 50-store mark, compared with only two in 1985 (Tannenbaum, 1996, p. A1).
Our results suggest that the ability to learn from a larger experience base and to transfer knowledge from one store to another contributes to the greater productivity of multi-store relative to single-store franchises.
Results of a study by McEvily and Zaheer (1999) are consistent with the recom- mendation that being embedded in a network improves organizational performance. The researchers examined whether participating in regional institutions, Manufacturing Extension Partnership (MEP) centers, improved the capabilities of small manufactur- ers. The MEP centers provide training courses, workshops, equipment demonstrations, supplier certification, and the like to small manufacturers. Based on an analysis of data from 227 small manufacturers in the metal-working sector located in the Midwestern area of the USA, McEvily and Zaheer (1999) concluded that participation in a regional network was generally associated with enhanced competitive capabilities.
The transfer results from the franchise study are generally consistent with our previous results on the extent to which transfer of learning occurs (Argote, Beckman, & Epple, 1990; Epple, Argote, & Murphy, 1996). The previous studies found that intra-plant transfer across shifts within a production facility was greater than trans- fer across geographically separated production facilities, such as the shipyards. Groups within a single plant such as two shifts are more related than geographically separated groups. Previous results concerning transfer of learning are, therefore, consistent with the results presented here.
Events that occurred in the food franchises after we completed data collection provided additional validation for our finding about the importance of being embed- ded in a multi-store network. Three of the stores in the sample closed or changed owners due to productivity problems. All three stores that closed or changed owners were single-store franchises. These stores were not able to benefit from production experience at other stores. Consistent with our results, these stores were less pro- ductive than their counterparts in multi-store franchises.
Several other studies have examined learning and knowledge transfer in the con- text of franchise organizations. Knott (2001) compared the behavior of establish- ments that left franchises to those that remained and found that establishments that left franchises drifted from the routines learned through the franchise and also failed to adopt innovations. Both drifting from routines and the lack of innovation contrib- uted to poorer performance in establishments that left franchises as compared to those that remained. Winter, Szulanski, Ringov, and Jensen (2012) found that the use of templates from the franchisor by establishments was more effective when those templates were replicated exactly than when they were adapted. More specifically, deviation from the product mix in the franchisor’s template decreased the survival chances of establishments. Thus, routines and templates may be more valuable when they are replicated than when they are adapted.
Source: Argote Linda (2013), Organizational Learning: Creating, Retaining and Transferring Knowledge, Springer; 2nd ed. 2013 edition.