The investment decision process can be divided into three parts: (1) the analysis and selection of a list of stocks suitable for current investment, (2) the formulation of an investment policy, and (3) the selection of a portfolio (see Fig. 10.1 ). Although the selection process contains rules on diversification and on how to determine the number of shares to buy, the essence of the investment process lies in carrying out the prior analysis -Steps 1 and 2. Thus, a major part of the model’s function is to convert the information on the economy, industry, and companies as found in financial journals and reports into a list of stocks suitable for current investment. The next part (Step 2) consists of formulating an investment policy from the information about the beneficiary or client involved. The final section of the model performs the task of actually selecting the required portfolio.

Figure 10.1 Structure of trust investment process.
Now that we have outlined the investment process and the method of analysis used in constructing the model, the only remaining question before we proceed to describe the model is the effect of the organization and the fiduciary relation on the trust investment process.
Since banks are responsible for all investments made in their name, elaborate procedures are set up to review and approve all investment decisions. Also, the necessity of being able to justify their investment decisions in a court of law has led trust investors to create a set of criteria for judging the quality of any given portfolio or investment. For all practical purposes these criteria can be reduced to one maxim: A security is of investment quality if and only if it is being held or is being bought by other leading trust funds. Clearly, this maxim is circular in nature and if strictly true would preclude change. However, the smaller the bank the truer the maxim, so that innovations come from the larger banks acting by themselves or in small groups. If innovations do not occur frequently, this maxim then asserts that the general list of stocks that are considered suitable for trust investment will remain fairly stable over time. The addition of a further observation — namely, that trust investors eschew taking losses, i.e., selling stocks whose prices have fallen below the purchase price — allows an even stronger prediction to be made: The basic list of stocks that are considered to be suitable for trust investment by a particular bank will remain fairly stable over time, any changes being in the form of additions. Thus, for any given trust investor, the basic list of stocks from which he can choose is given to him by the historical record. At a particular point in time, however, an investor selects stocks from a subset of his basic list. This subset is defined by a concept of relative valuation. As expectations, prices, yields, and so forth change with time, so does the content of this subset.
1. Selection of stocks suitable for current investment
The information used to derive the current list of stocks is classified into three main categories: general economy, industry, and company. The content of the information processed and the manner in which interrelations are formed differ among these categories, but the basic mechanisms that sort and process the information are the same.
For each category there is a set of attributes that corresponds to the important variables in that category. 10 For example, the set of attributes for individual companies contains such attributes as sales, earnings per share, cash flow per share, profit margin, dividends per share, and so forth. The specific values are determined by the information given to the model.
Processing the data. All information except that dealing with economy and industry forecasts is fed into the model in numerical form. These data consist of the historical values of each attribute in the system for the last ten years. The data are entered in the form of lists, and from these basic lists the model creates, for each attribute, three additional lists. The first list contains the mean value of the ten historical values; the second contains a set of nine values that record the rate of increase (or decrease) of each value in the historical record over the value immediately preceding it; the third list contains the average rate of change of the values for the entire ten-year period. Thus, the basic information given to the model is processed so that it is expressed in terms of rates of change, ratios, or both. The rates and ratios are directly comparable throughout the system.
Information on forecasts is entered into the model in two different forms. Forecasts for economy and industry variables are converted for input into a three-valued scale– “above,” “below,” or “equal to.” The values are based on published predictions in financial reports and journals that a given variable is going to rise, fall, or stay the same over the next interval of time. For the analysis of company performance, however, numerical forecasts are needed, and in a further attempt to avoid conflicting opinions, forecasts are taken from the Value Line Investment Survey.
Only current forecasts are used. Previous forecasts are not kept and the model makes no attempt to evaluate them. This procedure may not be too realistic, for it ignores the effects of personal preferences on perception. However, since the model is not equipped to handle second guessing and other judgmental modifications, the forecasts are assumed to be reliable.
Before we discuss the role of expectations in the model, it is worth emphasizing that this is a model of trust investment behavior. By and large, trust investment is long- term investment. Trust investors do not engage in trading stocks for their clients and they do not look to the long-term growth of the economy and the market to justify their investments. This is not to say that they remain aloof from daily, monthly, or yearly fluctuations, but rather that their emphasis is on the analysis of industries and their respective companies. Their basic belief is that the market will eventually recognize a company’s “true value.” Thus, in general, trust investors analyze companies and not the market.
Evaluating the data. The model uses two main processes to evaluate company performance: the first determines the relative performance of each company with respect to the other companies in its industry; the second determines the relative value of each company’s stock with respect to current market valuation.
The relative performance of a company is determined by deriving the relative performance of each attribute of a company with respect to the same attributes of all other companies within the same industry. This measure is computed as the difference between the mean value for the attribute and the mean of the distribution of the attribute means. This difference is taken as a per cent of the distribution mean and is then converted into the three-valued scale of “above,” “below,” or “equal to.” Thus, the Relative Performance List for a company contains measures of the performance of each of its attributes with respect to the attributes of the other companies within its industry.
The relative value of each company’s stock is determined by a pair of measures. The objective of these measures is to determine whether the current market price can be justified in the light of expected earnings and the price investors have been willing to pay for the stock in the past. The two metrics consist of (1) the difference between the mean (ten-year) price-earnings ratio and a price-earnings multiple obtained by dividing the current market price by the expected earnings per share three to five years from now, and (2) the difference between the mean and the current priceearnings ratios. These differences are taken as a per cent of the historical mean price-earnings ratio and are recorded as “above,” “below,” or “equal to” the historical mean. Thus, for each company the Relative Value List is a pair of “aboves,” “belows,” or “equals to” that under two possible conditions will form a pattern of only “aboves” or “belows.”
The many interrelations. Up to now we have described the mechanisms that process the data as though they were independent of each other. Although this is true to a certain extent, these mechanisms are related by the process that selects the stocks suitable for current investment. 12 This selection process is composed of two parts: a scanner and a selector.
The scanner examines the expectation lists of the industries and economy, notices the patterns of “aboves” and “belows” generated by these lists, and reports these findings to the selector. The selector takes these results and, depending upon what the pattern is, applies a set of tests to all the companies in the system. These tests are applied to the two values on the Relative Value List and consist essentially of a relaxing of constraints during prosperous times and a tightening up of constraints during recessions. Those companies that pass the tests are placed on the special list known as the A-list. It is from this list that the portfolio selections are made.
2. Formulation of an investment policy
In order to determine a client’s goals, the investment officer has two main sources of information — an administrative officer’s interview with the client and the written record. The former provides the investor with some subjective impressions of the client, the latter with a copy of the legal instrument (often a will) setting up the trust. In most cases this instrument contains information about the beneficiary, the investment powers of the bank, the disposition of the principal, the desired amount of income, and so forth. The instrument also contains information on the beneficiary’s age, marital status, number and age of dependents, place of legal residence, and income tax bracket. Armed with this information, the investment officer must now decide on an account investment policy lying somewhere along the continuum between the extremes of growth and income.The model simulates this process by another “pattern-recognition” process. The information on the client is entered into the model as a set of attributes — e.g., client’s profession, income tax bracket, age, etc. -whose values are recorded on the three-valued scale: “high,” “med,” or “low.” As in the previous case, the function of the scanner is to examine the list of attributes, to notice the pattern that they form, and to report the result to the selector. The function of the selector is to take the pattern of values given to it by the scanner and to convert it into an investment policy. Although there are a large number of possible combinations of growth and income, in practice only four categories are used:
Growth account. Assets are expected to appreciate at an average rate of 10 per cent per year, income is not stressed, and fluctuations in principal are tolerated.
Growth and income account. Assets are expected to appreciate at 5-6 per cent per year; dividend yield should approach 2-3 per cent per year.
Income and growth account. Dividends are expected to yield 3-4 per cent per year; assets are only expected to appreciate at 3-4 per cent per year.
Income account. Size and stability of income are important, growth is not stressed, and expected dividend yield is 4-6 per cent per year. To each investment policy there corresponds a pattern of “highs,” “meds,” and “lows” (see Fig. 10.2 ). Thus, the selector takes the pattern of values generated by the scanner and by a series of tests selects the appropriate investment policy.
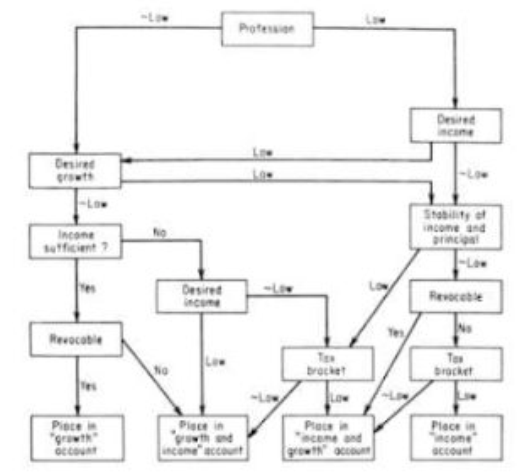
Figure 10.2 Selector for investment policy.
3. Selection of a portfolio
As mentioned earlier, the selection of a specific portfolio is essentially a process of mapping the set of industries and companies found on the A-list onto the desired investment policy. The mapping yields a subset of industries and companies that is further reduced to a specific set of stocks for a portfolio by the addition of some extra constraints. This process is divided into the following four sections:
Selection of industries appropriate to investment policy. Despite the large overlap among the characteristics of various industries, the trust investment officer associates a set of industries with each goal. Since this association depends on the characteristics of the goal as well as the general characteristics of the companies within each industry, the particular set of industries associated with a given goal may include some of the industries that are associated with other goals. Some industries on the list contain companies that vary only slightly in their individual characteristics, e.g., banks or utilities; others, such as oils, are more heterogeneous and appear on several lists. Since the investment officer’s classification of an industry’s characteristics changes slowly, the model takes these lists as given. Thus, for each investment policy there is now a list of industries whose companies are both currently acceptable and appropriate to the investment performance desired from the portfolio.
Selection of companies. Once the list of industries has been generated, the companies are selected for participation by the application of still another scanner- selector mechanism.
The scanner performs the task of ordering the companies in each industry on the basis of the dominant attribute of the investment policy. For example, if an income portfolio is being selected, the scanner ranks the companies in each industry on the basis of yield. The selector takes the first company from the industry that heads the list and applies a set of tests to it.
These tests consist of a series of binary decisions on the performance and expectations of important attributes. Since the importance of specific attributes depends upon the investment policy that is being applied, the series of tests will vary with each investment goal.

Figure 10.3 Growth portfolio discrimination net.
The tests, which are qualitative in nature, are applied in turn to the companies within each industry. Unless the actual value of some attribute deviates considerably from the test value, the selector will accept the first company that is processed. If, for some reason, the first company does not pass the tests, the selector moves on to the second company and repeats the process. If no company from that industry is able to pass through the set of tests, the selector moves on to the next industry. If after processing all the industries, funds still remain to be invested, the selector returns to the first industry from which no selection was made and recommences processing. This time, processing begins at that test which immediately precedes the spot where the selector stopped on the first run. As soon as a company is selected, the selector moves on to the next industry.
Diversification. Diversification is achieved by insisting that all accounts participate in at least five industries and that participation in stocks be limited, in general, to one per industry. When the portfolio includes bonds and preferred stocks, each $10,000 invested in bonds or preferreds is taken to be equivalent to a participation in one industry. Hence, for an account of $50,000 with $20,000 invested in government bonds, the model would require that the remaining funds be invested in at least three industries.
Size of participation. The number of shares to be purchased of each company that is selected is determined by a process that computes the average number of dollars to be invested in each company and then divides this figure by the price of the particular company’s stock. In small accounts — that is, accounts with less than $50,000 to invest in common stocks -this figure is rounded to the nearest multiple of five; in large accounts round lots (100 shares) are purchased whenever possible.
The selection process continues as long as there are funds remaining for investment. When the funds have been used up, the selection process stops and the stocks that have been chosen become the required portfolio.
Source: Skyttner Lars (2006), General Systems Theory: Problems, Perspectives, Practice, Wspc, 2nd Edition.