We next consider the same set of issues for a very different kind of organi- zational population: semiconductor manufacturing firms. Since there are many obvious technical, environmental, and operating differences between national labor unions and semiconductor companies, comparing the dynamics of the founding and entry rates in the two populations provides a strong test of the generality of our model. In particular, this comparison (along with the one in the next section on newspaper publishing firms) allows us to assess possible differences in the entry and founding processes for market and non-market organizations.
The comparison is complicated because there are important differences in the data available on the two populations. These differences led to modifications in the operations used to define both events and variables for study. As we discussed in Chapter 7, we do not necessarily observe the foundings or start-ups of firms in the semiconductor industry. Rather, we observe the entry of firms into the merchant semiconductor market. Some of these firms may be new organizations, so that entry and founding are equivalent events. However, some new entrants have a prior organizational existence. The dynamics of entry must differ from the dynamics of founding if only because foundings involve most of the same requirements as entries, but in addition involve organization-building activities that entries do not necessarily involve.
Another difference between the two populations is the length of the historical record. The semiconductor industry has existed for only about 40 years, as compared to the 150 years of national union history. Consequently, the maximum number of yearly observations is much smaller. On the other hand, the population of semiconductor firms has been much more volatile. For example, while the peak years for labor unions saw 19 foundings, there were 78 entries for semiconductors in the peak year, 1969.
We do not have precise data on the timing of entry. Our method of data collection allows recording only the year of entry. Therefore, we use only one of the methods we employed in analyzing founding rates of labor unions: maximum likelihood estimation of Poisson regressions based on yearly counts of foundings. We have compared annual listings of firms in 40 adjacent years to determine entries; thus we have 39 years for which entries and exits were observed. Since our models predict entries using variables measured in the prior year, the number of observations is actually 38. This small number of observations severely constrains the complexity of the models that can be estimated and makes insignificant effects likely.
Referring to equations (9.6) and (9.7), we define density (Nt) as the number of firms in the list of semiconductor manufacturers in the Electron-ics Buyer’s Guide in a given year. The number of entries is the number of firms appearing in the Guide in a given year that had not appeared for at least the two previous years. All variables defined in terms of life events, such as density, number of entries, and number of exits, are measured at the beginning of the year for which a count of entries applies.
We also include two other variables in some specifications to reflect variations in economic conditions. These are indicators of two crucial resources used to found (and maintain) semiconductor firms: the total sales of semiconductor devices in North America and the cost of capital, measured at year-end by Moody’s AA corporate bond interest rate. Both of these variables were measured in the year prior to the year in which foundings were counted.
We recorded 1,197 entries into the semiconductor industry between 1946 and 1984. Figure 9.5 shows the variation over time in number of entries. The entries seem to come in waves; note that the four-year period between 1969 and 1973 contains almost 28 percent of all entries. Figure 9.6 shows yearly variations in population density. The number of firms in the industry rose more or less linearly from 1945 to a peak of 335 in 1970, then stabilized and declined slightly over the subsequent 15 years. The general pattern is surprisingly similar to that for national labor unions in Figure 9.2. Despite the many differences between the organizations in the populations, at least some observable features of the population dynamics have been quite similar.

Figure 9.5 Semiconductor firm entries by year
A comparison of Figures 9.5 and 9.6 shows that the period of highest density corresponds to the peak period of entry. This contrasts sharply with the union pattern, in which the peak period of foundings occurred during a time of only moderate density. Figures 9.5 and 9.6 suggest that density dependence in the entry may have been monotonic in the semiconductor industry. We check in subsequent analyses to see whether this is the case once period effects and economic conditions have been taken into account.
Figure 9.7 shows that sales of semiconductor products have grown almost exponentially over the history of the industry, which comes as no surprise. Clearly the drop in entries toward the end of the series in Figure 9.6 cannot be explained in terms of a drop in demand for the products of the industry.
As in our analysis of union foundings, we control for some environmental changes by using period effects. The substantive status of the periods differs somewhat between the two analyses. The definition of periods for analyzing labor unions follows policies and legislation designed to hinder or help the union movement, while the events that we use to mark the history of the semiconductor industry are discoveries and inventions. It is not certain that these events had implications for entries into the population of merchant market producers, although we think that they did. Such implications are much more obvious for foundings of labor unions.

Figure 9.7 Semiconductor firm sales by year (in millions of dollars)

Figure 9.6 Density of semiconductor firms by year
Another difference between the periods specified for semiconductor firms and for national labor unions concerns the clarity of dates. The enactment of legislation can be associated with a precise date much more easily than can the introduction of an innovation. Diffusion of innovations is a continuous process that does not conform completely to the step deviations; thus it is somewhat arbitrary to pick a given year as the point in which innovations occur. Nonetheless, our reading of the history of the industry and interviews with industry pioneers suggest that important changes were concentrated in a few years.
As with unions, we define these periods so that they proceed from some starting date to the end of the study, 1984. The first period (suppressed in the analysis) starts at the beginning of the industry in 1945. The second period begins in 1960. Its beginning is marked by the introduction of the integrated circuit and the development of some important innovations in production processes that reduced the cost and risk of manufacturing these devices. The third period begins in 1970. Between 1970 and 1972 the first thousand-bit MOS dynamic random access memory (RAM) chip, the bipolar RAM, and the microprocessor were all introduced (Wilson, Ashton, and Egan 1980, p. 41). With these innovations, computers became much less costly and more powerful. The exploding market for computers spilled over into the market for the vital semiconductor components.
Inspection of Figure 9.6 shows that the middle period was marked by frequent entry into the industry. During the third period the rate of entry dropped in spite of the expansion in the market, as we noted earlier. Because these periods are defined as partially overlapping time intervals, the antilog of each period effect tells the ratio of the rate in that period relative to the rate in the previous period.
1. Results
For continuity, we organize the exposition of our analysis around the same questions we asked concerning the union data. The first empirical question is whether the rate of entry has had a pattern of density dependence such as that found for national labor unions. The first column in Table 9.5 reports estimates of the generalized Yule model; it reveals that density has a strong and significant effect on the entry rate. According to this estimate, the rate rises sharply with density but at a slowly decreasing rate. The model whose estimates are found in column 2 adds the second-order effect of density to the model in the first column. This addition does not improve the fit significantly, since the drop in G2 is only 1.47. Moreover, the second-order effect of density, which is positive in opposition to our hypothesis, is no larger than its standard error. So with this simple specification of the model, we find no evidence that the entry rate has been subject to nonmonotonic density dependence. Columns 3 and 4 add additional covariates to the basic model. Adding effects of total sales, interest rates, and recent entries makes both the first- and second-order effects of density positive and significantly different from zero.
Table 9.5. Poisson regression estimates of density dependence in the entry rates of U.S. semiconductor companies, 1947-1984

Figure 9.8 displays the effect of density using the estimates in column 4. We see that the entry rate increased as an approximately linear function of density over the observed range. Although N2 has a positive effect, the coefficient’s magnitude is small relative to that of log N. Over the range of variation in our data, the curve does not show a pronounced tendency to bend upward. These data show no evidence of non-monotonic density dependence. So our suspicion, based on visual inspection of the raw counts of entries, that density dependence is monotonie is confirmed for semiconductor firms. Nonetheless, the monotonie effect of density is extraordinarily powerful. At high density, the entry rate is over forty times higher than the rate at zero density. These results suggest that growth in the number of firms in the industry accelerated the rate of entry by increasing the number of potential organization builders with appropriate technical background and perhaps by legitimating the industry and its organizational form.

Figure 9.8 Effect of density on entry rate of semiconductor firms (estimates from model 4 in Table 9.5)
Adding measures of environmental variables to the model (in column 3 of Table 9.5) improves the fit, but only at the .10 level. According to these estimates, growth in aggregate sales increased the rate of entry and high interest rates depressed it, as expected.

Figure 9.9 Effect of prior entries on entry rate of semiconductor firms (estimates from model 4 in Table 9.5)
The second question involves rate dependence, the effect of the flow of recent entries on the entry rate. The fourth column of Table 9.5 reports estimates of a model that includes effects of the previous year’s number of entries and its square. The addition of these regressors improves the fit significantly.48 And the first-order effect of recent entries is positive and the second-order effect is negative, as predicted.
In Figure 9.9 we can see that as the number of recent entries increases, the rate of entry rises and then falls. This wavelike pattern of entry may reflect the effects of variables not included in our models. For example, the availability of venture capital rises and falls with government tax policy, and its variations are not adequately captured by the bond interest rate. Our expectation of wavelike patterns in entry rates is based on our view that recent entries can provide a signaling function, encouraging other entries; this continues until the resources needed to build organizations begin to run out.
The period effects in Table 9.5 are consistently negative. They show a decline in the 1970s and the first part of the 1980s. According to the estimated effect of the second period in column 4, the rate was only exp(-.349) = .705 as large as the rate in the first period. So the rate of entry dropped by almost 30 percent after 1960. After 1970, it dropped by another 37 percent. Looking back at Figure 9.5, we can see that the crude number of entries actually rose during the 1960s. The analysis in Table 9.5 shows that this is misleading, however. Even without controls for sales, interest rates, and previous entries, the rate of entry drops. We suspect that the increased technological complexity represents increases in cost of entry as well as in opportunity. Of course, other events such as the rise of foreign competition could explain this decline.
2. Qualitative Implications
There is a clear difference in the qualitative patterns of density dependence in founding rates for national labor unions and in entry rates for semiconductor manufacturing firms. Recall that the founding rate of unions rose with density over roughly half of its observed range, and that the multiplier of density at the maximum was about four times the multiplier at zero density. Here we see that for the population of semiconductor firms, the positive effect of density operated over the full range of density. If the population as a whole is well below its carrying capacity at all times, a growing population creates opportunities. Growing firms provide more people to serve as trained entrepreneurs and more opportunities based in technologies that have not yet been commercialized.
Another interpretation is that this difference between unions and semi- conductor firms reflects mainly the difference in the kind of event under study. Semiconductor firms are observed upon entry to the industry, not necessarily when the corporations are first set up. Entry into an industry may well be an easier process than founding a firm.
3. Interactions between Subsidiary and Independent Firms
Next we turn to interactions between two substantively interesting sub- populations: subsidiary and independent firms. Some semiconductor firms are organized as free-standing corporations; others are corporate divisions, embedded in larger organizations. The potential advantages to organization as a free-standing corporation are the capacity for quick adjustment to changing conditions and a more single-minded attention to the interests of the organization. Corporate divisions enjoy the advantage of buffering by the parent firm, which allows them to tolerate short-run downturns in business. In addition, they can use the parent firm’s superior ability to make claims on the resource environment. For example, such divisions have access to capital markets through the parent firm to support expansion in capital investment or research and development. Indeed, such access is one of the common reasons why free-standing firms accept offers to be acquired and made part of a multidivisional firm.
Since the two kinds of firms rely on different kinds of resources and have different organizational structures, it seems likely that the entry process differs for the two subpopulations. So in the next step we investigate whether the processes do differ and whether there is any competition between subpopulations. As in the case of labor unions, we analyze yearly counts of entries in each subpopulation as functions of the density of the subpopulation, the number of recent entries into the subpopulation, and the density of the other subpopulation.
Table 9.6 reports estimates of parameters of models of entry into the population of subsidiary firms. Unlike the full-population estimates reported in the previous table, subsidiary firm entries show strong nonmonotonic density dependence. As was the case for unions, the first-order effect of own density is positive and the second-order effect is negative. The rate rises with low-level increases in density, but then declines with further increases at high density. So there has been intraform competition within the population of subsidiary firms, and the expected non-monotonic pattern is evident in this subpopulation.
On the other hand, competition between the forms does not appear to have characterized the dynamics of entries into the population of subsidiary firms. In fact, there is evidence of mutualism. The number of independent firms has a positive and significant effect on the entry rate of subsidiary firms.50 If independent firms provide support for the subsidiary firms, for example by serving as second sources or as scouts who identify new applications and markets, growth in the size of this population should increase the rate of entry into the population of subsidiary firms, and this is what we find here. Another interpretation is that the independent firms absorb uncertainty for the subsidiary firms by expanding and contracting the population as business competition rises and falls. If this is true, we would expect to see more competition in the entry rate dynamics of independent firms. This has indeed been the case.

Table 9.7 reports parallel results for the rate of entry into the other subpopulation, independent firms. Note first that the effect of own density is monotonie, as was the case for the population as a whole. Both first- order and second-order effects of density are positive and significantly different from zero.

Next we consider the cross-effect, the effect of the density of the other subpopulation. Analysis reveals that this cross-effect is non-monotonic. The first-order cross-effect is positive, and the second-order effect is nega-tive. It seems that increasing numbers in the subpopulation of subsidiary firms initially increased the rate of entry of independent firms; but, as the density of subsidiary firms increased at higher levels, the entry rate of independent firms dropped off rapidly.
In fact, Figure 9.10 shows that the estimated cross-effect at high observed levels of density of subsidiary firms falls below the effect at low density. At its minimum, the cross-effect has cut the entry rate of independent firms by roughly 30 percent. So we find that competitive effects on the entry rate of subsidiary firms concern processes within the subpopulation. But the competitive effect for independent firms comes primarily from the subpopulation of subsidiary firms.
In Tables 9.6 and 9.7 rate dependence is not estimated because it is not significant for either subpopulation. We can only speculate that the apparent rate dependence in the analysis of the full population (in Table 9.5) actually reflects the aggregation of competitive relationships between the two populations. The effect of “other” population density on “own” entry rate net of own density must be highly correlated with own lagged entry rate.
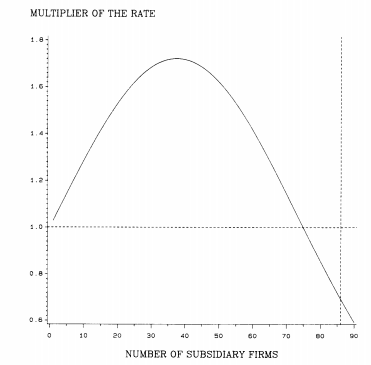
Figure 9.10 Effect of subsidiary firm density on entry rate of independent firms (estimates from model 2 in Table 9.7)
The period effects for both populations are not significant. The addition of total sales of semiconductor devices in North America to the models in Tables 9.6 and 9.7 improves the fit significantly. When the entire population is studied, total sales have insignificant effects. In Tables 9.6 and 9.7, its effects are negative. However, the industrial bond interest rate does not seem to have affected the rate at all.
Source: Hannan Michael T., Freeman John (1993), Organizational Ecology, Harvard University Press; Reprint edition.