Our study of national labor unions recorded 479 foundings over the 1836— 1985 period. Figure 9.1 shows how the events were distributed over time. A surge in foundings began in 1883 and continued until 1906; this was the most important period of building national unions. The peak years were 1897 and 1903, each with 19 foundings. A second brief peak occurred right after World War I, and a broader period of high activity occurred during the 1930s. In broad terms, we seek to learn whether these fluctuations in foundings were related to density, as our theory predicts.
The number of unions in existence (Nt) reflects the cumulative numbers of foundings and ending events (disbandings, mergers, and absorptions). Figure 9.2 shows how the number of unions (density) varied over the period of interest. The number fluctuated near zero until the Civil War era. It rose modestly until about 1881 and then grew explosively until 1905. From that point on, growth in numbers was slower and more erratic until the series reached its peak level of
211 in 1954. The last portion of the series shows consistent but modest contraction in the number of unions. Indeed, the number of unions in existence was stable during a period in which union membership surged and the national polity and economy changed greatly. This pattern suggests that fluctuation in density in this population has more to do with organizational ecological processes within the population of unions rather than with changes in social, economic, and political environments.
A crude way to learn about density dependence in union founding rates is to compare the series on foundings and density in Figures 9.1 and 9.2, respectively. This comparison suggests that the number of foundings has not simply been proportional to the size of the population. The rate was highest during a period in which density was considerably below its maximum (1881-1905); and the number of foundings was quite low in the period of peak density (1940-1960). So the comparison of the two series suggests that the relationship was indeed non-monotonic. We examine whether this conclusion holds under controls for environmental conditions and period effects in the analysis discussed next.
Figure 9.2 also shows the growth in numbers of the two most commonly distinguished forms of union organization: craft and industrial unions. The craft union form has its roots in the guild. It consists of journeymen craftsmen organized collectively for the purpose of controlling conditions of work, including regulating the flow of new members into the trade and training new members (apprentices). A key feature of the craft form is that workers at a work site were typically organized into several different unions. We classify unions as using the craft form when they define their target membership in terms of occupations rather than industrial locations. The craft form, defined this way, has not been restricted to the highest skill levels; semiskilled and unskilled workers often formed narrowly defined unions in industries dominated by the craft form of organization (for example, the Union of Hodcarriers and Building Laborers, founded in 1893). As Figure 9.2 makes clear, most national unions in the United States have had the craft form. Consequently, the growth profile of craft unions closely follows the pattern for the whole population. The number of craft unions reached a peak level of 156 in 1953 and has dropped by about a third since that time.
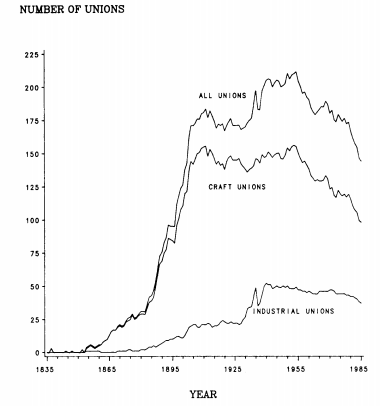
Figure 9.2 Density of union forms by year
The industrial form ignores differences among occupations and skill levels. Unions with this form seek to organize all production workers at work sites. The number of industrial unions, always much smaller than the number of craft unions, began to grow gradually in the 1890s and spurted during the 1930s. It reached its peak level of 52 in 1940 and has remained quite stable since that time.
Our research strategy capitalizes on knowledge of the full history of the population of national unions. Inspection of Figure 9.2 makes it clear that little would be learned about the underlying dynamics by considering only the twentieth century. Analysis must include the middle of the nineteenth century in order to capture the growth from low to high density. This means that the set of covariates available for use in analysis is limited to those whose series cover this crucial period. Since most of the commonly used time series on industrial activity, wage levels, strike activity, and so forth begin in 1890, or even 1930, this is a severe restriction.
In fact, only a few measures of environmental conditions are available for most of the 1836-1985 period, as we pointed out in describing the design of the union study in Chapter 7. For this reason, we conducted much of the empirical analysis using period effects. That is, we assumed that the founding rate varied by historical periods but was constant within periods (net of the effects of density and the flow of recent foundings). We tried a number of alternative period definitions and obtained the best results with a five-period model.31
This analysis divides the 150-year history as follows. The first period begins in 1836, the start of national unionization, and ends in 1886, the year in which the AFL was founded. The second period begins in 1887 and ends in 1931. The third period begins in 1932 with the New Deal and the Norris- LaGuardia Act of 1932, which limited the power of employers to gain injunctions against striking unions, and the National Industrial Recovery
Act in 1932-1933. The subsequent Wagner Act, passed in 1935, gave substantial legal protection to unions and union organizing campaigns (see Tomlins 1985). This third period ends in 1947, when the Taft-Hartley Act rolled back some of the gains that unions won under the Wagner Act. The fourth period runs from 1948 to 1954. The last period begins in 1955, the year of the merger of the AFL and CIO, and runs to 1985. It is characterized by continuous decline in the fraction of the labor force in unions.
In representing period effects we used an “effect coding.” The first period is the (excluded) baseline. The variable called “Period 2” in the tables is coded as one for the years 1887 through 1985 and zero otherwise. “Period 3” is coded as one from 1932 through 1985, and so forth. This coding makes it easy to evaluate the effects of adjacent periods. In the log- linear models we use, the antilog of the effect of “Period 2” is the ratio of the rate in the second period to that in the first; the antilog of the effect of “Period 3” is the ratio of the rate in the third period to that in the second, and so forth.
We also used period effects to deal with the claim that coordinated nationwide offensives by employers damaged the fortunes of unions and depressed the founding rate. Although it is difficult to find agreement on the precise dates of these offensives, it seems clear that the peak periods were 1903- 1908, the period of a national “open shop” drive, and 1919— 1929, the period of the so-called “American Plan of Employment” campaign, led by the National Association of Manufacturers. We constructed an index that distinguished the years of these employer offensives from other years.
Finally, we also used period effects to deal with the possibility that wartime conditions affected the founding rate of unions. We used periods that distinguished years during the Civil War, the two world wars, the Korean War, and the Vietnam War as well as periods that distinguished only the two world wars, during which unions were given a relatively protected status under wartime production controls.
We explored the effects of several measures of general economic conditions. These include an index that identifies years of economic crisis and depression (1836-1984), taken mainly from Thorp and Mitchell (1926); the real wage of common laborers (1836-1974), as compiled by David and Solar (1977); and a number of indicators coded from The Historical Statistics of the United States: Colonial Times to 1976 (U.S. Bureau of the Census, 1975): the number of business failures (1857-1984), gross national product per capita (1889-1984), indexes of the value of new building permits (1868-1939), and an index of railroad construction (1830-1925). We also used the number of patents issued for inventions (1830-1984), an index of productivity per man hour in manufacturing (1860-1914), and an index of capital investment (1865-1984) as indicators of rising mechanization of production. In addition, we used data on the flow of immigrants (1836-1984) and year-to-year changes in such flows. None of these measures has any systematic or sizeable effect on the union founding rate when period effects and these measures are included in the model.
We recorded the exact dates of foundings and other events when this information was available. We learned the exact founding date for slightly fewer than half of the cases, and only the year of founding for the rest. With this mixture of data, two strategies for analysis make sense: (1) ignore the information on exact timing and analyze only year-to-year variations in numbers of foundings; or (2) use some scheme for allocating events with missing information on month and day to some date within the known year of founding. In previous publications we used the second strategy (Hannan and Freeman 1987). When the timing within a year was not recorded, we assigned a time using a random number uniformly distributed over the year.33 Here we report estimates using both approaches. We report the results of partial likelihood (PL) estimators as well as maximum likelihood (ML) estimators of Weibull models, in each case using either the exact observed date or a randomly chosen date within the year of founding. We also report ML estimates of Poisson regressions that use only the yearly counts of foundings.
Both procedures have implications for measuring the density and number of recent foundings. When dates within years are unknown, the ordering of events within the year is also unknown. Therefore, we defined density (Nt) for all spells beginning in a calendar year as the number of unions in existence on January 1 of the year in question. Similarly, we defined the number of foundings in the prior year, Bt-1, as the count in the calendar year prior to the year in which the interval begins. Each interval in the same calendar year is assigned the same values of Nt and Bt-1, those pertaining to the density at the beginning of the year and the count of foundings in the prior year. Similarly, in the Poisson regressions, counts of foundings in a year, Bt, are regressed on the number of unions in existence at the beginning of the year, Nt, and the number of foundings in the previous year, Bt-1.
1. Results
Our empirical analysis of national labor unions deals with four questions. (1) Does the founding rate depend on density, and, if so, what is the form of the dependence? (2) Does the rate also depend on the number of recent foundings? (3) Do effects of density and recent foundings persist when environmental effects are included in the models? (4) Does competition between forms affect the founding process?
In considering density and prior foundings, we are particularly interested in contrasting monotonie and non-monotonic models. Non-mono- tonic effects support our claim that the effects of institutionalization are countered by strong competitive processes. Thus comparisons of the two kinds of models provide information about the strength of intrapopulation competition on the founding process and the role of founding processes in stabilizing numbers in the population.
We begin with the two models of density dependence developed at the beginning of the chapter: the generalized Yule model and our non-monotonic model. The main results appear in Table 9.1, which reports estimates for the period from 1836 to 1985 using two different approaches.35 Columns 1-3 contain PL estimates, which treat the dates as exact, including those that were chosen at random within years. Columns 4-6 report ML estimates of Poisson regressions of the yearly counts of foundings. The models in the two sets, columns 1-3 and 4-6, differ in how they specify the effects of density and recent foundings. The first and fourth columns report estimates of a generalized Yule model (equation 9.1) in which the rate varies among five periods discussed earlier. The estimated efect of den-sity, which is the parameter α in (9.1), is 0.179 with the PL estimator and 0.235 with the Poisson regression estimator. Since both estimates lie be-tween zero and one, these results imply that the founding rate increases at a (rapidly) decreasing rate with increasing density.

The crucial step, according to our argument, is adding the square of density to the generalized Yule model. Columns 2 and 5 show that this addition improves the fit of the models significantly.36 So the null hypothesis that density dependence is monotonic turns out to be very implausible given these data. In other words, the data strongly prefer the non-mono- tonic model over the monotonic one.
Do the estimated effects of density agree with the predictions of the model in (9.4b)? Columns 2 and 4 show that the answer is yes. The effects of density have the predicted signs: the first-order effect, a, is positive and the second-order effect, y, is negative.
The second question concerns the effect of recent foundings. Columns 3 and 6 report estimates of the parameters of model (9.6a), which adds a log- quadratic specification of the number of foundings in the prior year. In each case, the null hypothesis of no effect of recent foundings can be rejected at the .01 level.37 So the hypothesis advanced by Delacroix and Carroll (1983) in analyzing founding rates of Argentinean and Irish newspapers finds support here.
Next we consider the effects of the periods. As we noted earlier, the antilogs of the period effects are the ratio of the rate in the period in question to that in the preceding period. Estimates of the period effects in Table 9.1 reveal that the founding rate rose in the second period, following the founding of the AFL. According to the sixth column of Table 9.1, the rate was exp(.615) = 1.85 higher in the second period than in the first. It also rose significantly in the third period, which marks the New Deal. The multiplier for the third period is exp(.379) = 1.46, which means that the founding rate during the New Deal was 46 percent higher than in the second period. The estimated effect of the fourth period, beginning with the Taft- Hartley Act, does not differ significantly from zero. But the rate did drop sharply and significantly after the merger of the AFL and the CIO, the start of period 5. The estimates imply that the rate in the fifth period was about a third as large as that in the fourth period.
Apparently the five periods do a reasonably good job of representing the broad secular changes in the founding rate. When these four period effects are included in the models, none of the environmental covariates listed earlier has an effect that differs significantly from zero at the .10 level. If we were interested primarily in describing the effects of particular environ- mental variations, we might prefer to begin with models that contain effects of these covariates before adding period effects. However, our experience with many different specifications is that the findings about the theoretically relevant processes of density dependence and rate dependence are not sensitive to choice of which covariates to use as long as the period effects are included.
From the perspective of ecological theory, the most important result is that using many different representations of environmental variations does not eliminate or even diminish the effects of density and recent foundings. Estimates very similar to those in Table 9.1 are obtained when the environ- mental covariates listed earlier (and the period effects for wars and “em- ployer offensives”) are included in the models. Our provisional conclusion is that estimates of effects of density and recent foundings are quite robust with respect to specification of the effects of environmental conditions on the founding rate.38
Next we consider the dependence of founding rates on the length of time since the most recent founding and on unobserved heterogeneity in order to check the sensitivity of the basic findings. We have presumably taken care of possible duration dependence in the rate by using partial likelihood estimators.39 However, the models whose results we just discussed assume that the founding rate (conditional on the covariates and the period effects) is not affected by unobserved heterogeneity. In order to evaluate the sensitivity of our findings with respect to this assumption, we estimated the generalized gamma model (of Weibull time dependence) and (gamma distributed) unobserved heterogeneity discussed in Chapter 8.40 It turns out that the special case of the Weibull model fits essentially as well as the generalized gamma model. This result suggests that there was duration dependence in the founding rate but that there is little effect of unobserved heterogeneity in these models. So we present the results of the Weibull models rather than those of the generalized gamma model.41
The results of estimating Weibull models with the same causal structure as the models in columns 3 and 6 in Table 9.1 appear in Table 9.2. Several features of these estimates are noteworthy. First, the Weibull model im- proves significantly over an exponential (time-independent) model with the same specification of the effects of the covariates. There does appear to be duration dependence in the founding process. The estimated scale parameter, σ, exceeds unity. Since σ = p-1 (see equation 8.12), pˆ = 1/1.2 = .83. This estimate of the Weibull parameter implies that the founding rate declines slowly with the passage of time since the previous founding. The less time that has elapsed since the last founding, the lower is the probability of a founding in the near future. Second, the estimates of density dependence and rate dependence are quite similar to those in Table 9.1. Adding explicit duration dependence does not alter substantive conclusions about these ecological processes.
2. Qualitative Implications
Substantive implications of these findings for the ecology of unions can be seen in plots of the estimated relationships. Because the various estimators agree substantially about the effect of density, it does not matter for quali- tative conclusions which of the estimates we use. Figure 9.3 plots the estimated relationship using the estimates in column 3 in Table 9.1. The vertical axis tells the multiplier42 of the rate, that is, the coefficient that is multiplied by the effects of other covariates in the model. The multiplier of density exceeds unity over the observed range of density, [0, 211), which is indicated by the vertical dashed line. At its maximum, when N ≈ 70, the rate is 3.6 times larger than the rate at N = 0.
Because the estimated rate rises very sharply with increasing density in the range near N = 0, it is more informative to use the multiplier at some non-zero level of N as the point of comparison. For instance, take the level N = 5 as the baseline; then the multiplier is 1.73 higher than the rate at N = 0. So a value of 1.73 becomes the baseline for comparison here. When density increases to the historical maximum N = 211, the multiplier equals 1.30. In other words, our estimates imply that the founding rate in popula- tions with 5 national unions was higher than that in a population of 211 unions, since 1.73 is larger than 1.30. Put differently, the founding rate when there were only 5 unions was 33 percent larger than it was at the historical high of density. These comparisons, which hold exactly for the first period and no foundings in the prior year, show that density drives the founding rate in a large population down to the level that holds in a very small population of unions. The rate rises sharply with increasing density in the lower range and drops sharply with increasing density in the higher range, indicating that the founding rate is very sensitive to density.


Figure 9.3 Effect of density on union founding rate (estimates from model 3 in Table 9.1)
Figure 9.4 plots the effect of prior foundings, again using the estimates from column 3 in Table 9.1. As in Figure 9.3, the implied effect is positive over the observed range. This effect is weaker than the effect of density, but it is still considerable. The multiplier due to prior foundings is largest when B ≈ 15, at which point the multiplier is 1.9 times that when B = 0, which is a useful baseline since many years had zero foundings. From that level, the multiplier drops with additional prior foundings, but it is roughly 1.8 when the number of foundings reached its maximum level of 19. The strong effect of prior foundings on the founding rate may have contributed to the wavelike pattern of observed foundings. When the population is below the carrying capacity, a perturbation that produced a high level of founding activity in one year seems to have raised the rate for the next year substantially.
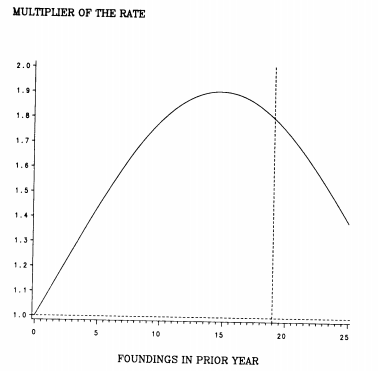
Figure 9.4 Effect of prior foundings on union founding rate (estimates from model 3 in Table 9.1)
3. Interactions between Craft and Industrial Populations
The final part of this analysis considers founding rates of craft and industrial unions. It has two objectives: (1) to learn whether the processes differ by form; and (2) to examine competition between forms. We start by estimating models for each population using the non-monotonic model discussed to this point. Then we estimate model (9.7), which incorporates interpopulation effects. Tables 9.3 and 9.4 report the results for craft unions and industrial unions respectively. Again we use both PL analysis of durations between foundings and ML analysis of Poisson regressions of yearly counts of foundings. However, we now calculate durations and yearly counts separately for each subpopulation. This is the sense in which we treat the two forms as possibly having different dynamics.
The results for the craft founding rate can be seen in Table 9.3. The models in columns 1 and 4 in this table mimic the models in columns 4 and 6 in Table 9.1, but with one important difference: counts of all unions (N) and of all prior foundings (B) are replaced by counts of craft unions (NC) and craft foundings (BC). This specification allows us to consider how the founding rate of craft unions depended on the density and recent foundings in this subpopulation. We find that craft density and number of recent craft foundings have the predicted non-mono tonic effects. Indeed estimates of these effects are fairly similar to those for the entire population of unions in Table 9.1, which is not surprising since craft unions constituted such a large share of the total population of unions.
What happens when the cross-effect of density of industrial unions (Nt) is added to the model? Columns 2 and 5 in Table 9.3 give the answer. In this case, choice of estimator makes a difference, but it turns out that the difference is not substantively important. The PL estimates tell that Nt had a negligible effect on the craft founding rate. This estimated cross-effect is much smaller than its standard error. The ML estimates of Poisson regres- sions, however, indicate that the cross-effect is negative and significant. Thus the competitive effect between subpopulations was a strong one according to the Poisson regressions. The estimate in the fourth column implies that the founding rate of craft unions was negligible when there were 50 industrial unions (since exp(-.304*50) ≈ 0). Put differently, growth in the density of industrial unions from zero to its historical maximum eradicated the founding rate of craft unions, according to the Poisson regression estimate.
In the final step, we allowed the craft founding rate to depend log- linearly on both Nt and N2t. That is, we added N2t to the models in columns 2 and 5. The results, which are reported in columns 3 and 6, indicate that this alteration improves the fit significantly at the .01 level in the case of the PL estimator. The estimated effect of Nt is positive; the effect of N2t is negative. These estimates imply that increasing density of industrial unions raised the craft founding rate until Nt = 35. From that point on, increasing numbers of industrial unions depressed the craft founding rate strongly. In fact, the implied multiplier for industrial density is essentially zero when Nt = 50.

In contrast to the case for the PL estimates, adding N] does not signifi- cantly improve the fit of the Poisson regression model in column 6 (at the .10 level). So within the hierarchy of models we have chosen, the two estimators favor different specifications: the model whose estimates appear in the third column for PL and the one in the sixth column for the Poisson regression.44 But this difference does not mean much substantively. Estimates of the two models tell the same qualitative story: over most of the range of variation, increasing density of industrial unions strongly depressed the founding rate of craft unions. Thus the rise of the industrial form of union organization and the spread of industrial unions appear to have played a major role in depressing the founding rate of craft unions.
We turn finally to the results for industrial unions in Table 9.4. The PL estimates in column 1 give the predicted non-monotonic pattern of depen- dence on own density. The first-order effect of industrial density is positive, the second-order effect is negative. The Poisson ML estimates have the same signs, but are just significant at the .10 level or not significant.
Next we add the cross-effect of craft density (NC). According to the PL estimate in the second column, the cross-effect of NC is negative and significant. According to the Poisson regression in column 5, this crosseffect is negative but insignificant.45 However, the point estimates are quite similar for the two estimators. Adding a second-order effect of NC (in the third and sixth columns) does not improve the fit much with either estimator. So the density of craft unions appears to have had a negative effect on the industrial founding rate. According to column 2, this effect was a strong one even though it was just barely significant. When craft density reached its peak of 156, the multiplier of the cross-effect equals exp(-.026 * 156) = .017. As was the case for the craft union form, the founding rate of the industrial unions form was close to zero when its competitor’s density reached its historical maximum. However, this con- clusion must be tempered by the fact that the effect is significantly different from zero for only one of the estimators.

The pattern of period effects parallels that for craft unions with one important exception. The similarities are that the rate rose significantly in the second period and dropped significantly in the fifth period. The exception concerns the effect of the New Deal, in period 3. Although this period had a lower rate for craft unions, the founding rate of industrial unions jumped enormously during the New Deal: the estimates imply that the industrial founding rate during the New Deal was 15 times higher than in the previous period. As numerous commentators have noted, the protections for union organizing incorporated into New Deal legislation were especially important in stimulating the foundings of industrial unions. However, the large negative effect of the fifth period cancels all of the gains of the second and third periods. The estimated rate of industrial founding in the fifth period is slightly less than that in the baseline first period.
As a final step in analysis, we tried pooling the data used separately in the analyses just discussed. Estimates of the pooled models can be used to test whether the pattern of effects differs overall for the two populations— whether the ecologies of the two populations differ with respect to foundings. The pooled models use the specifications discussed thus far but add a covariate that distinguishes craft from industrial unions. That is, the pooled models specify an additive effect (in the log-linear model) of the industrial form. We find for all models that the pooled models fit significantly more poorly than the less constrained separate models that allow different effects for the two populations. We conclude, therefore, that there really has been a difference in the founding processes of these two subpopulations. This result suggests that we have in fact identified meaningful subpopulations.
Source: Hannan Michael T., Freeman John (1993), Organizational Ecology, Harvard University Press; Reprint edition.